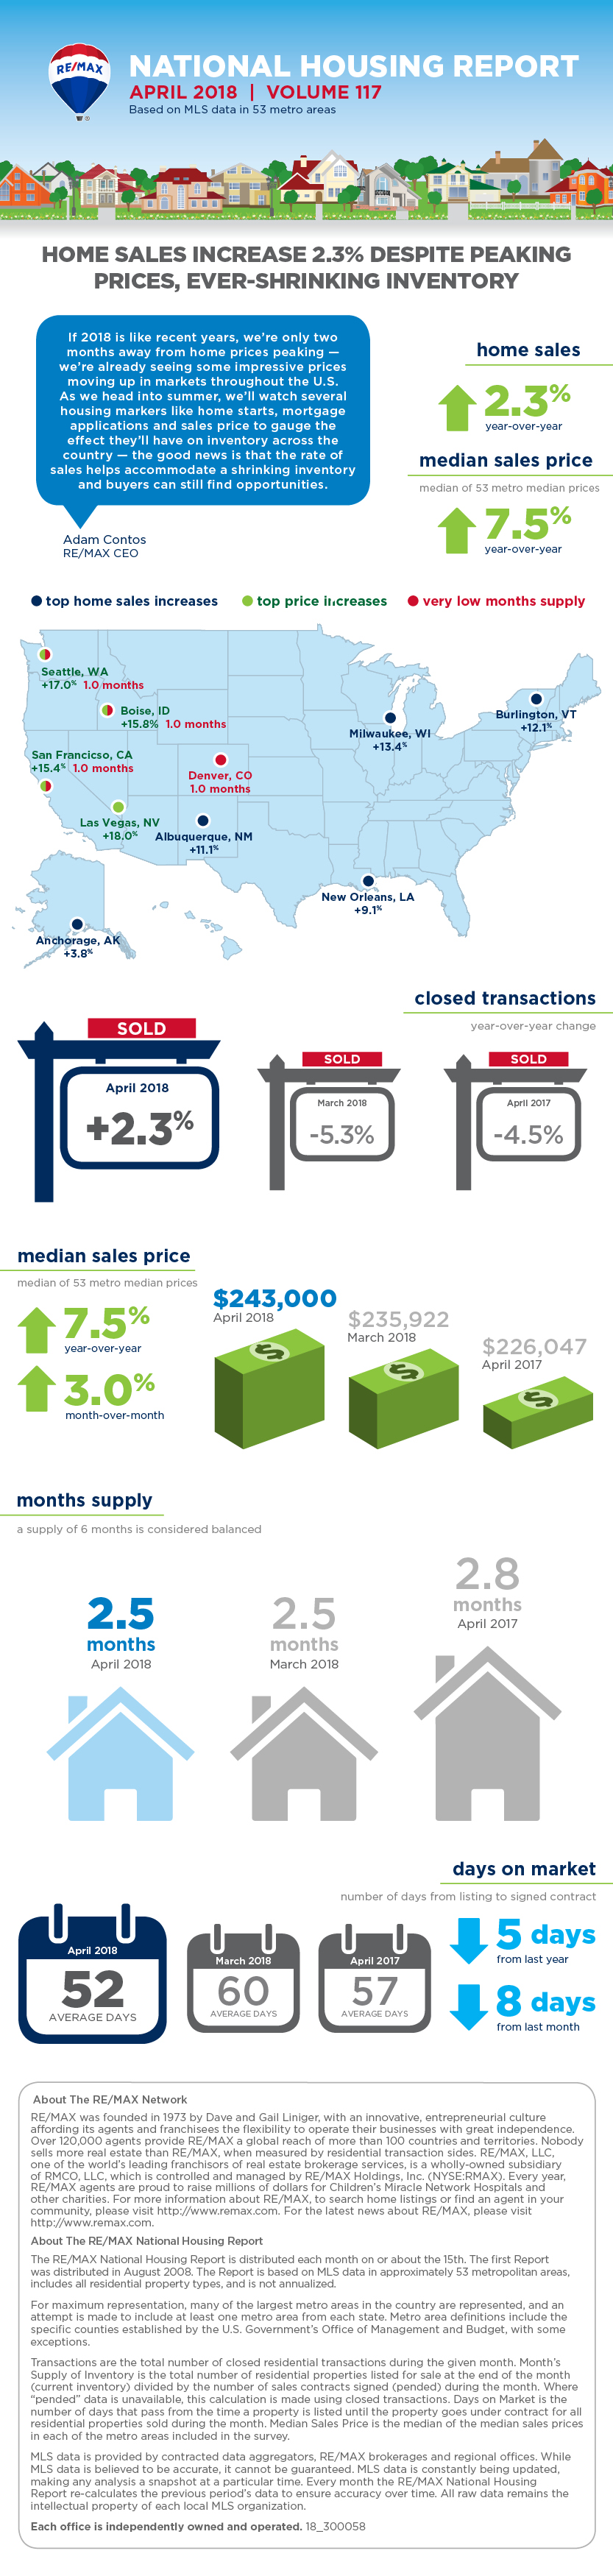
Home sales increased 2.3 percent year-over-year in April 2018 in the face of record-low inventory, according to the May RE/MAX National Housing Report.
“If 2018 is like recent years, we’re only two months away from home prices peaking—we’re already seeing some impressive prices moving up in markets throughout the U.S.,” says Adam Contos, CEO of RE/MAX. “As we head into summer, we’ll watch several housing markers like home starts, mortgage applications and sales price to gauge the effect they’ll have on inventory across the country.
“The good news is that the rate of sales helps accommodate a shrinking inventory, and buyers can still find opportunities,” Contos says.
Closed Transactions
Of the 53 metro areas surveyed in April 2018, the overall average number of home sales increased 3.6 percent compared to March 2018 and increased 2.3 percent compared to April 2017. Thirty-eight of the 53 metro areas experienced an increase in sales year-over-year, including Milwaukee, Wis., 13.4 percent, Burlington, Vt., 12.1 percent, Albuquerque, N.M., 11.1 percent, and New Orleans, La., at 9.1 percent.
Median Sales Price
In April 2018, the median of all 53 metro median sales prices was $243,000, up 3 percent from March 2018 and up 7.5 percent from April 2017. Three metro areas saw a year-over-year decrease in median sales price: Trenton, N.J., -5.1 percent, Birmingham, Ala., -3 percent, and Wilmington/Dover, Del., -0.5 percent. Nine metro areas increased year-over-year by double-digit percentages, with the largest increases seen in Las Vegas, Nev., 18 percent, Seattle, Wash., 17 percent, Boise, Idaho, 15.8 percent, and San Francisco, Calif., 15.4 percent.
Days on Market
The average days on market for homes sold in April 2018 was 52, down eight days from the average in March 2018, and down five days from the April 2017 average. The metro areas with the lowest days on market were San Francisco, Calif., at 19, Seattle, Wash., at 21, Denver, Colo., at 23, and Las Vegas, Nev., at 29. The highest days on market averages were in Augusta, Maine, at 119, Burlington, Vt., at 110, and Hartford, Conn., at 91. Days on market is the number of days between when a home is first listed in an MLS and a sales contract is signed.
Months Supply of Inventory
The number of homes for sale in April 2018 was up 3.4 percent from March 2018, and down 11.3 percent from April 2017. Based on the rate of home sales in April, the months supply of inventory remained at 2.5 from March 2018, and decreased compared to April 2017 at 2.8. A 6-month supply historically indicates a market that’s balanced equally between buyers and sellers. In April 2018, all 53 metro areas surveyed reported a months supply at or less than 6, which is typically considered a seller’s market. The markets with the lowest months supply of inventory continue to be in the West, with Boise, Idaho, Denver, Colo., San Francisco, Calif., and Seattle, Wash., at 1.
For more information, please visit www.remax.com.
For the latest real estate news and trends, bookmark RISMedia.com.