 Nationally, house prices continued to rise in the second quarter of 2013. According to the most recent release by the Federal Housing Finance Agency, U.S. house prices rose by 2.1 percent on a quarter-over-quarter seasonally adjusted basis. This is the eighth consecutive quarterly increase for the House Price Index – Purchase Only. Over the past two years house prices have climbed by 8.1 percent.
On a month-over-month basis, the June increase in house prices were geographically widespread, increasing in every division of the country. As Chart 1 illustrates, the largest gains took place in the Pacific and Mountain divisions, regions of the country containing states, like Nevada and California, which experienced the largest price declines.
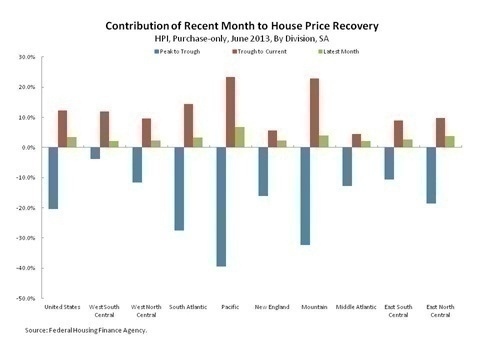
Chart 2 updates analysis discussed in an earlier post comparing national house prices, which began a sustained recovery in 2011, with mortgage applications for purchase, a measure of mortgage demand. This relationship is of particular interest because of the recent spike in mortgage rates. Higher mortgage rates could dampen housing demand and restrain house price growth. According to data released by the Mortgage Bankers Association, mortgage applications for home purchase increased by 0.7 percent over the month of June, but declined by 6.6% over the month of July. Since reaching its most recent peak in April, mortgage applications for purchase have fallen by 7.8 percent, possibly reflecting the 92 basis point increase in mortgage rates that took place over this same period.