
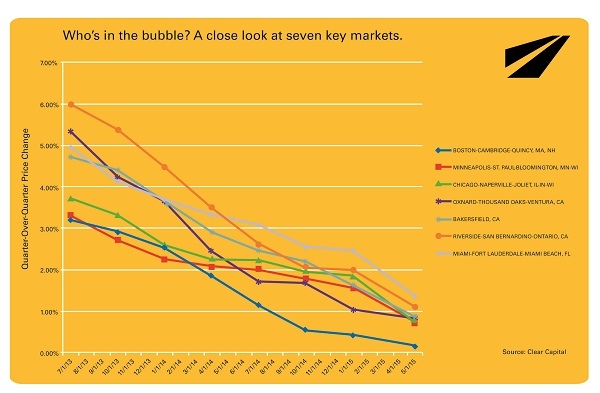
 Clear Capital recently released its Home Data Index™ (HDI) Market Report with data through May 2015. The report found that, outside of the usual headline-making markets, there are seven markets, considered “major” in density and culture, which are in bubble territory. These markets have had two years of consecutive quarterly softening, meaning each subsequent quarter, over the two-year period starting May 2013, has seen less growth than the previous quarter. The company has ruled out seasonality since two summers and winters have gone by with no observed impact on the softening.
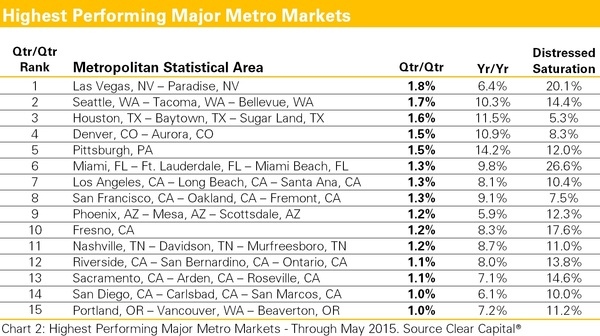
Though May’s top performing markets continue to see improvements, no one market is on pace to match the rates of growth observed over the last 12 months. In other words, something big needs to happen for the nation’s steadiest markets to best their current yearly rates of growth, something that has yet to be seen in force as we enter the height of the real estate season.
After a long winter in some parts of the country, namely the Northeast and Midwest, the regions continue to struggle to shake off winter’s chill. While the Midwest rebounded from April’s negative threshold of -0.10 percent, back into positive territory at 0.10 percent, the region’s volatility stands to stymie consumer confidence through the spring and summer buying seasons.
Data through May 2015 reports a 0.1 percent increase in the national quarterly growth rate from 0.5 percent to 0.6 percent. That’s the first increase observed since November 2014 and 7 consecutive months of declining, quarterly gains.
“At the surface, May data is serving up more of the same, which is an interesting indictment of the economic uncertainty facing the industry,” says Alex Villacorta, Ph.D., vice president of research and analytics at Clear Capital. “Small increases or declines in quarterly gains reflect both the normalization off of the ‘correction-to-the-correction’ and the uncertainty of the health of the housing market. These small changes track well with what we forecasted at the start of 2015—continued moderation and year-end gains of between 1 percent – 3 percent. But as we know all too well, there’s no such thing as standard fare in housing. Each micro market has its own flavor and prices.
“While it may come as no surprise that key markets with booming tech economies, like the San Francisco Bay area, are in bubble territory, there are seven others that meet our same definition of a bubble. After two years of moderating gains, originating from the irrational exuberance of once-in-a-lifetime deals, quarterly growth has decreased, stagnating to less than 1 percent in all markets except the Riverside, CA MSA and Miami, FL MSA after observing an average rate of 4.4 percent two years ago. Seven markets is certainly cause for concern and cumulatively bubbles bursting across the nation could put the June and spring rush for housing on the back burner.”
For more information, visit www.clearcapital.com.


