One word sums up February home sales across the country: inventory, according to the March RE/MAX National Housing Report.
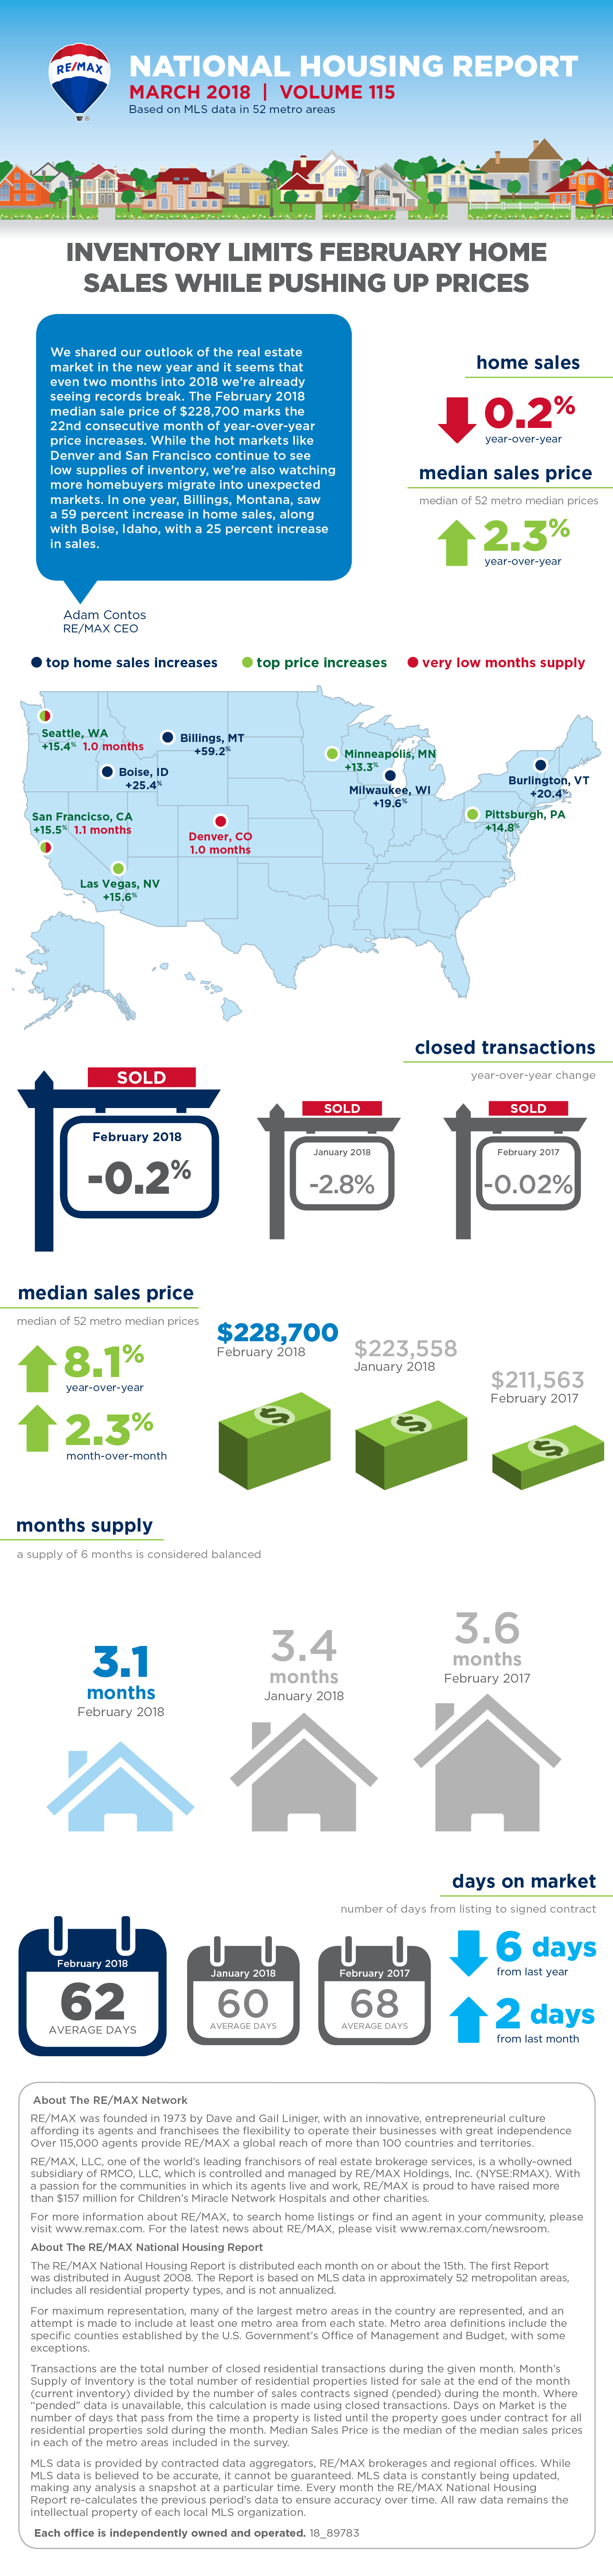
“We shared our outlook of the real estate market in the new year and it seems that even two months into 2018 we’re already seeing records break,” says Adam Contos, CEO of RE/MAX. “The February 2018 median sales price of $228,700 marks the 22nd consecutive month of year-over-year price increases.
“While the hot markets like Denver and San Francisco continue to see low supplies of inventory, we’re also watching more homebuyers migrate into unexpected markets,” Contos says. “In one year, Billings, Mont., saw a 59 percent increase in home sales, along with Boise, Idaho, with a 25 percent increase in sales.”
Closed Transactions
Of the 52 metro areas surveyed in February 2018, the overall average number of home sales increased +3.5 percent compared to January 2018 and decreased -0.2 percent compared to February 2017. Twenty-six of the 52 metro areas experienced an increase in sales year-over-year, including, Billings, Mont., +59.2 percent, Boise, Idaho, +25.4 percent, Burlington, Vt., +20.4 percent, Milwaukee, Wis., +19.6 percent, and Richmond, Va., +13.2 percent.
Median Sales Price
In February 2018, the median of all 52 metro median sales prices was $228,700, up +2.3 percent from January 2018 and up +8.1 percent from February 2017. Two metro areas saw a year-over-year decrease in median sales prices: Albuquerque, N.M., -0.2 percent and Burlington, Vt., -5.2 percent. Eighteen metro areas increased year-over-year by double-digit percentages, with the largest increases seen in Las Vegas, Nev., +15.6 percent, San Francisco, Calif., +15.5 percent, Seattle, Wash., +15.4 percent, Pittsburgh, Pa., +14.8 percent, and Minneapolis, Minn., +13.3 percent.
Days on Market
The average days on market for homes sold in February 2018 was 62, up two days from the average in January 2018, and down six days from the February 2017 average. The metro areas with the lowest days on market were Las Vegas, Nev., and San Diego, Calif., both at 36; Denver, Colo., and Nashville, Tenn., both at 35; and Seattle, Wash., at 33. The highest days on market averages were in Wilmington, Del., at 117, Wichita, Kan., at 101, Washington, D.C., at 99, and Tulsa, Okla., at 93. Days on market is the number of days between when a home is first listed in an MLS and a sales contract is signed.
Months Supply of Inventory
The number of homes for sale in February 2018 was down -1.0 percent from January 2018, and down -13.7 percent from February 2017. Based on the rate of home sales in February, the months supply of inventory decreased to 3.1 from January 2018 at 3.4, as well as decreased compared to February 2017 at 3.6. A 6.0-months supply indicates a market balanced equally between buyers and sellers. In February 2018, 48 of the 52 metro areas surveyed reported a months supply at or less than 6.0, which is typically considered a seller’s market. The metro areas that saw a months supply above 6.0, which is typically considered a buyer’s market, were Miami, Fla., at 7.0, New Orleans, La., at 6.8, Augusta, Maine, at 6.5 and Burlington, Vt., at 6.4. The markets with the lowest months supply of inventory continued to be in the West, with Denver, Colo., and Seattle, Wash., both at 1.0 and San Francisco, Calif., at 1.1.
For more information, please visit www.remax.com.
For the latest real estate news and trends, bookmark RISMedia.com.