 RealtyTrac® recently released its July 2015 U.S. Home Sales Report, which shows sales of properties in-foreclosure and cash sales were down from a year ago to multi-year lows while year-to-date U.S. home sales in 2015 are at an eight-year high, and the U.S. median home price in July was at an 82-month high.
The sale of properties sold while in the foreclosure process (not including bank-owned properties) accounted for 6.4 percent of all single family and condo sales in July, down from 6.6 percent of all sales in June and down from 8.0 percent in July 2014 to the lowest monthly share since January 2000 — the earliest that data is available.
All-cash buyers accounted for 22.6 percent of all single family home and condo sales in July, down from 23.7 percent of all sales in the previous month and down from 26.5 percent of all sales in July 2014 to the lowest percentage of cash sales in a month since July 2008 – a 7-year low, and down from the most recent peak of 39 percent in February 2013 (highest going back as far as RealtyTrac has national data, January 2000)
A total of 1,344,129 single family homes and condos sold in the first six months of 2015, according to public record sales deeds collected by RealtyTrac, the highest number of sales in the first half of any year since 2007.
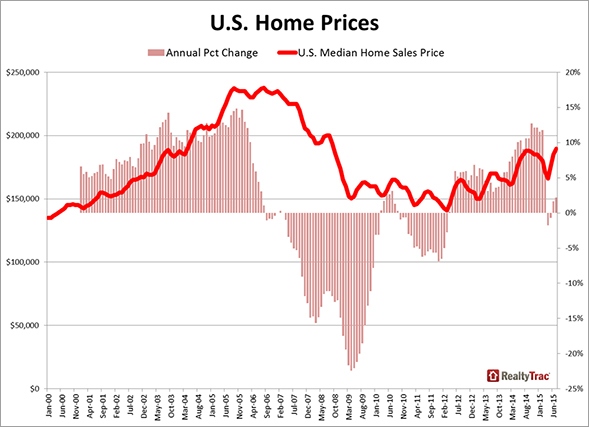
The U.S. median home sales price in July was $189,500, up 2 percent from the previous month and up 2 percent from a year ago to the highest level since September 2008.
“While the stock market may be on a roller coaster as of late, the housing market is still on solid ground, with the eight-year low in cash sales combined with the eight-year high in overall sales volume in the first half of the year evidence that housing is successfully transitioning from an investor-driven recovery to one that is drawing in traditional buyers as a good foundation for sustainable growth going forward,” says Daren Blomquist, vice president at RealtyTrac. “That’s not to say there are no cracks in the foundation of this recovery, the top three of which are housing affordability — or lack thereof in some high-flying markets — along with overdependence on capricious cash buyers — both foreign and domestic — in some markets, and the persistent overhang of underwater homeowners who continue to represent heightened default risk given any future economic shockwaves.”
10 local markets reach new home price peaks in July
Out of 161 markets analyzed for home sales prices (excluding non-disclosure states), 10 metros (6 percent) reached new home price peaks in July, and 20 percent of the 161 metro areas analyzed have hit new home price peaks in 2014 or 2015.

“We are beginning to sense increasing inventory. Homeowners may be thinking that now is the right time to sell. There are some very real issues regarding the oil and gas industry, the threat of the Federal Reserve raising rates, a nationally less than robust economy, and negative vibes from foreign economies,” says Gene Vaughn, owner/broker of a real estate firm covering the Northern Coloradomarket. “Construction of new homes is in a higher gear to better meet demand and we may very well see a modest cooling in the fourth quarter of this year.”
“During the heat of the summer in July, the Ohio housing markets displayed further signs of balance and recovery. With listing inventories on the rise, month-over-month, in the Ohio metros of Columbus, Dayton, and Cincinnati; consumers are experiencing greater choices and renewed demand,” says Michael Mahon, president of a real estate company covering the Cincinnati, Dayton and Columbus markets in Ohio. “While overall sales unit volume dropped slightly in July, month over month, throughout many Ohio metros; the reflection of increased average sales prices lifted closed sales dollars volume throughout much of Ohio.”
65 percent of U.S. markets at 8-year high for home sales midway through 2015
Out of 190 markets analyzed for home sales volume, 124 (65 percent) reached an eight-year high in home sales through the first half of the year, and 26 markets (14 percent) were at a 10-year high for home sales in the first half of 2015. Four markets reached an all-time high for sales volume in the first half of the year since 2000, the earliest data available in the report: The Villages, Fla.; Lincoln, Nebr., Pittsburgh, and Denver.
“All indicators continue to point to a normalizing market. A downtick in all cash and distress sales coupled with 100 percent of sales at estimated value and increasing median prices bodes well for continued strength through the fall,” says Mark Hughes, chief operating officer with a real estate company covering the Southern California market. “We have seen growth in inventory which should tamp down this run of price growth; we need consistency to support the gains and to help maintain confidence moving forward.”
“With market inventory remaining extremely tight, the fact that sellers are holding out for full price offers is clearly not a surprise. In fact, there are several sub-markets where sales prices exceed list prices,” says Matthew Gardner, chief economist at a Seattle real estate firm. “I still expect to see healthy growth in sales prices across the board through the balance of the year. Inventory constraints persist which, in concert with persistently low interest rates and above average job growth, is acting as a catalyst for buyers to continue to feel comfortable with the market and the high price levels which are being sought.”
Cash share of sales up in New York City and 56 other markets
Metros with the highest share of cash sales in July were all in Florida — Sebastian, Fla. (54.6 percent), Homosassa Springs, Fla. (53.3 percent), Sebring, Fla. (52.6 percent), Naples, Fla. (50.2 percent), Port St. Lucie, Fla. (49.1 percent), Punta Gorda, Fla. (48.7 percent), The Villages, Fla. (48.4 percent), Miami, Fla. (47.6 percent) and Sarasota, Fla. (47 percent).
Other major metros with a high percentage of cash sales in July included New York, N.Y. (43.2 percent), Orlando (37.6 percent) and Tampa (35.3 percent), Las Vegas (32.6 percent), Rochester, N.Y. (32.6 percent), and Detroit (31.9 percent).
In 57 of the 200 markets analyzed for cash sales (29 percent), the share of cash sales increased from a year ago, counter to the national trend. Those markets included New York, Los Angeles, Philadelphia, Baltimore, Denver and San Jose.
Metros with highest share of in-foreclosure sales
Metros with highest share of in-foreclosure properties in July were Salisbury, N.C. (23.6 percent), Rockford, Ill. (17.1 percent), Morehead City, N.C. (16.3 percent), Baltimore, Md. (16.1 percent), Toledo, Ohio (15.2 percent) and Chicago, Ill. (14.7 percent).
Other major metros with a high percentage of in-foreclosure properties in July included Tampa, Fla. (12.7 percent), Las Vegas, Nev. (12.3 percent), Milwaukee, Wisc. (11.7 percent), Virginia Beach, Va. (11.4 percent) and Cincinnati, Ohio (11.3 percent).
In 61 of the 172 markets analyzed for in-foreclosure sales (35 percent), the share of in-foreclosure sales increased from a year ago, counter to the national trend. Those markets included Chicago, Atlanta, Boston, Baltimore and Pittsburgh.
For more information, click here.


