How well is America saving? The ninth annual America Saves Week survey has found that only two-fifths (40 percent) of U.S. households report good or excellent progress in “meeting their savings needs.” This widespread lack of savings progress is consistent with responses to other survey questions:
- Saving at least 5 percent of one’s income (49%)
- Saving enough for retirement with a “desirable standard of living” (52%)
- Automatic saving outside of work (43%)
- No consumer debt (38 percent)
Responses to other questions, however, suggest that around two-thirds of Americans are making at least modest savings progress: Seventy percent reported at least some progress in meeting savings needs. Sixty-six percent reported saving at least some of their income. And 63 percent reported “sufficient emergency savings to pay for unexpected expenses like car repairs or a doctor visit.”
More Men than Women Report Saving Progress
On 12 separate questions on various financial well-being indicators, men’s responses were more positive than women’s responses, with differences ranging from five to thirteen percentage points. For example, 74 percent of men, but only 67 percent of women, reported that they were making saving progress, and 44 percent of men, but only 36 percent of women, reported good or excellent saving progress.
Similarly, 72 percent of men, yet only 60 percent of women, reported that they are spending less than income and saving the difference. This gender gap persisted for those saving at least five percent of income – 54 percent of men and only 45 percent of women.
“The most important reason for the gender gap in savings is differences in income and wealth,” notes Stephen Brobeck, executive director of CFA and a founder of America Saves. “The fact that men have larger incomes and financial assets than women makes it easier for them to save,” he adds.
Many Americans Acknowledge Retirement Savings Shortfall
When the survey asked whether respondents were “saving enough for a retirement in which you will have a desirable standard of living,” only about half of non-retired persons (52 percent) said “yes.” That figure was down three percentage points from last year (55 percent) and down six percentage points from 2008 (58 percent). Moreover, as for the other saver characteristics, there was a significant gender gap — 57 percent for non-retired men, and 47 percent for non-retired women.
For those non-retired persons who said they were not saving enough for retirement, about one-quarter (27 percent) said the main factor was high day-to-day expenses, and another quarter (25 percent) said the main factor was debt and related expenses, with about half this group (12 percent) citing education expenses and debt. Yet, for those under 45 years of age who were not unemployed, 22 percent said education expenses and debt. For those over 45 years of age who were not unemployed, the most cited expense (16 percent) after day-to-day expenses was mortgage or housing expenses.
For the first time, the annual America Saves Week survey asked for respondents’ views about participating in retirement programs. When asked the highest percentage of their salary that they would contribute to a plan offered by their employers with auto-escalation, more than four-fifths (82 percent) indicated that they would contribute more than three percent, with 40 percent indicating ten percent or higher. And when asked what they would do if their employer did not offer a retirement plan and they were automatically enrolled in an IRA administered by their state government with a default annual contribution of three percent, roughly equal percentages said they would contribute less than three percent (32 percent), three percent (31 percent), and more than three percent (28 percent).
Those with a Plan Save More Successfully
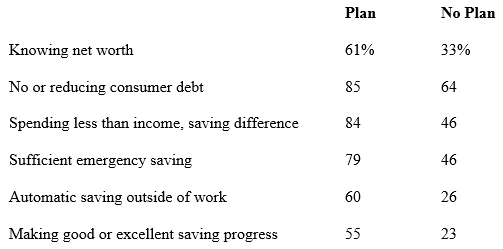
As the table below shows, those with a “savings plan with specific goals” save more successfully than those without a plan.

Income appears to be correlated with some but not all of these differences. More specifically, the financial well-being indicator gaps between those who plan and do not plan are always larger than those gaps between households with annual incomes of $25,000-$50,000, and those households with incomes above $100,000.
For more information, visit www.consumerfed.org.


