Of the 132.42 million homes that existed in the U.S. in 2011, 98.8 percent (130.85 million) were still there two years later, according to a report published by the Department of Housing and Urban Development (HUD) in 2016.
The report is called Components of Inventory Change: 2011-2013, and is based on the American Housing Survey (AHS). The AHS, funded by HUD and conducted in odd-numbered years by the U.S. Census Bureau, is the primary source of detailed information on housing in the U.S. It revisits the same housing units, making it possible to obtain counts of how many were lost between surveys.
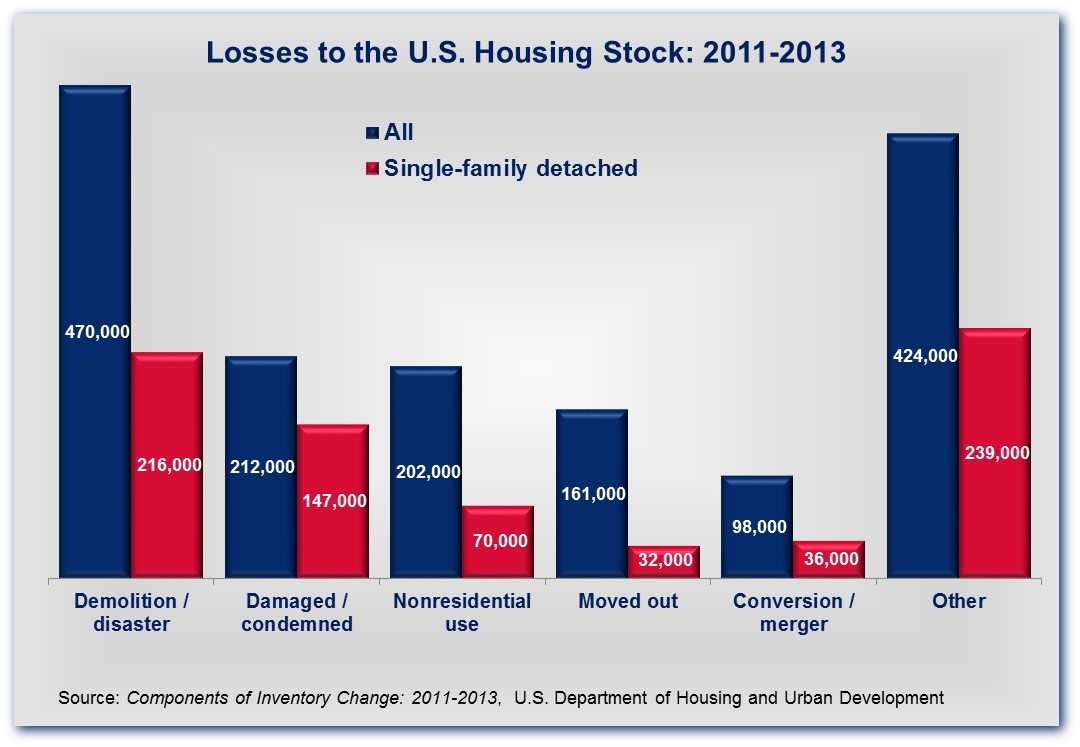
Of the 1,567,000 housing units lost between the 2011 and 2013 iterations of the AHS, 470,000 were due to demolitions and disasters, 212,000 were homes that became damaged or condemned, 202,000 involved putting existing homes to non-residential uses, 161,000 (primarily manufactured housing/mobile homes) were moved out from where they had been in 2011, 98,000 were due to conversions/mergers (e.g., a housing unit is lost when two smaller units are combined into a larger one), and 424,000 were units lost in some other way that fit none of these categories or couldn’t be determined.
These statistics imply that 0.59 percent of the housing units in the U.S. are lost in a given year, but there are differences depending on the type of structure. Mobile homes, for example, are considerably more likely to be “lost” (as they are obviously more susceptible to being moved out from their original locations). The largest category of homes in the U.S. is single-family detached, which accounted for 82.97 million, or about 62 percent, of the 132.42 million housing units that existed in 2011.
However, fewer than half (740,000) of the units lost between 2011 and 2013 were single-family detached. In addition to units moved out of their old locations, certain types of losses, like mergers and shifts to non-residential uses, are particularly uncommon among single-family detached structures. The annual loss rate for all single-family detached homes in the 2016 report was 0.45 percent.
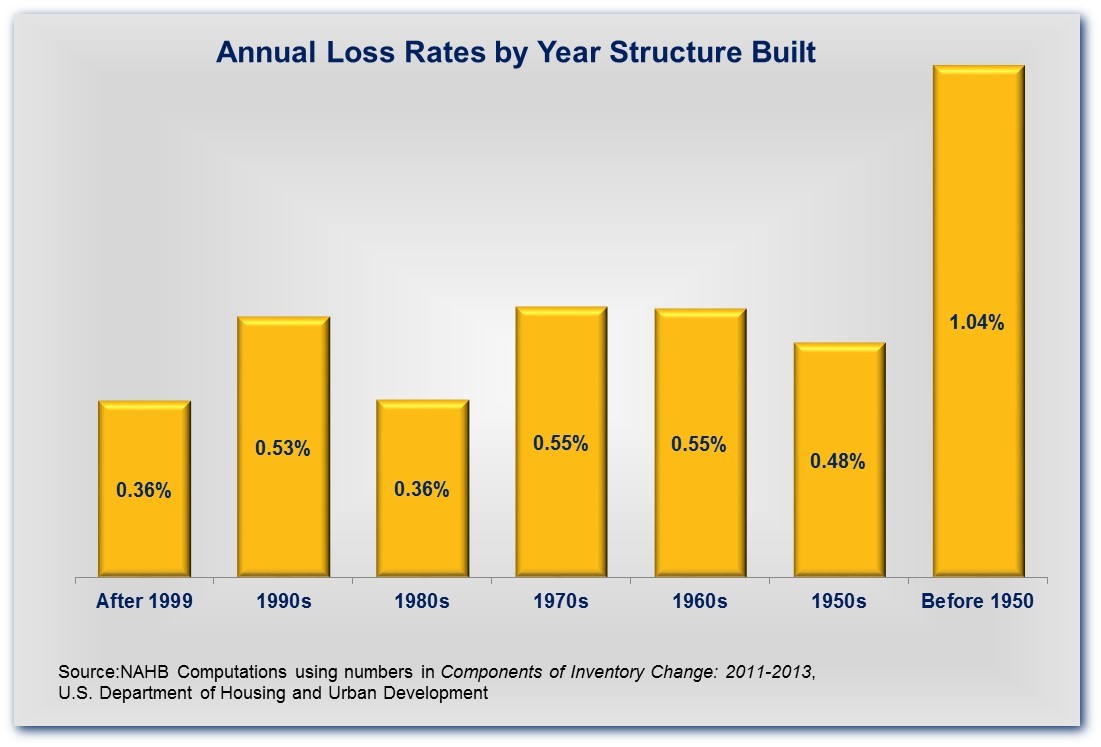
The loss rate also varies depending on age of the home. In general, the rate hovers around half a percent a year for homes built in 1950 or later, but jumps to slightly over 1 percent for homes built earlier than that. If these numbers remain consistent, they imply that half of the existing homes built 64 or more years ago will still exist 66 years from now—also, that half of the homes built recently will last for more than 100 years.
This was originally published on the National Association of Home Builders (NAHB) blog, Eye On Housing.


