Despite record low inventory for the month, October home sales increased 2.5 percent year-over-year and kept 2017 prices ahead of 2016, according to the RE/MAX National Housing Report.
“The housing market is steady and at least somewhat predictable, with record-low inventory and increasing prices in markets across the country,” says Adam Contos, co-CEO of RE/MAX. “With job growth and increased household formation, buyers will struggle and may even be priced out of the market until home-building catches up.”
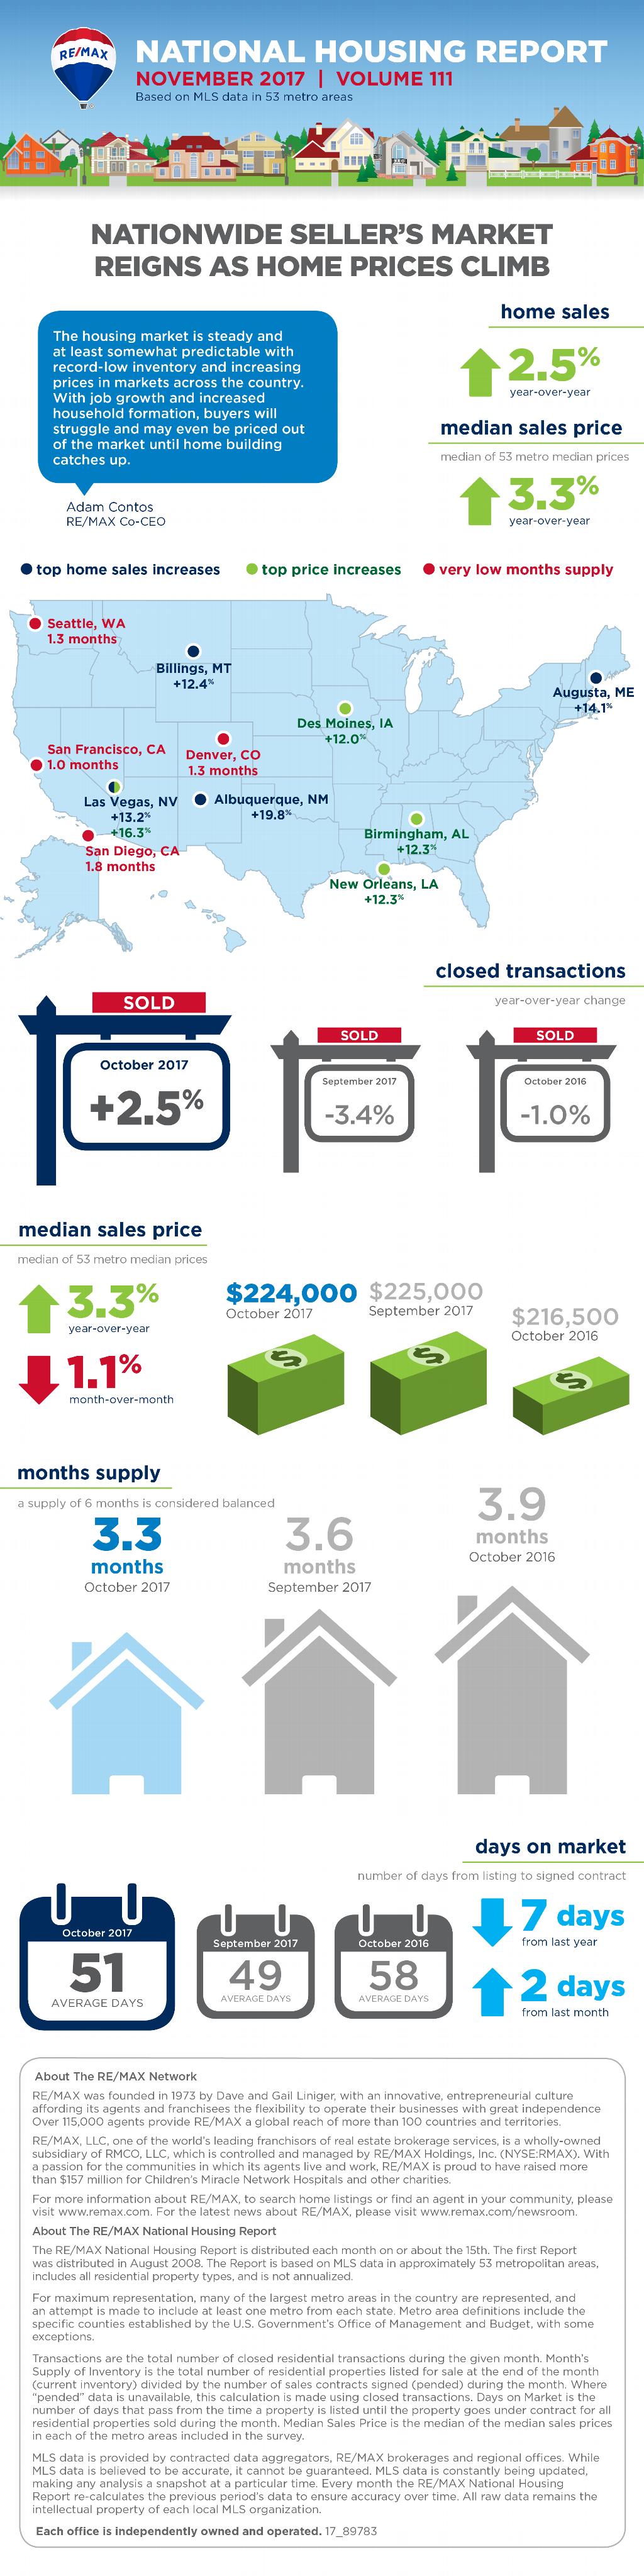
Closed Transactions
Of the 53 metro areas surveyed in October 2017, the overall average number of home sales decreased 3.4 percent compared to September 2017 but increased 2.5 percent compared to October 2016. Thirty-seven of the 53 metro areas experienced an increase in sales year-over-year including, Albuquerque, N.M., +19.8 percent, Augusta, Maine, +14.1 percent, Las Vegas, Nev., +13.2 percent, Billings, Mont., +12.4 percent, and Providence, R.I., +11.4 percent.
Median Sales Price
In October 2017, the median of all 53 metro median sales prices was $224,000, down 1.1 percent from September 2017 but up 3.3 percent from October 2016. Only three metro areas saw a year-over-year decrease in median sales price or remained unchanged (Wilmington/Dover, Del., -4.1 percent, Trenton, N.J., -1.0 percent, and Cincinnati, Ohio, 0.0 percent). Eight metro areas increased year-over-year by double-digit percentages, with the largest increases seen in Las Vegas, Nev., +16.3 percent, Birmingham, Ala., +12.3 percent, New Orleans, La., +12.3 percent, Des Moines, Iowa, +12.0 percent, and Seattle, Wash., +11.6 percent.
Days on Market
The average days on market for homes sold in October 2017 was 51, up two days from the average in September 2017, and down seven days from the October 2016 average. The four metro areas with the lowest days on market were San Francisco, Calif., at 24, Omaha, Neb., at 26, Seattle, Wash., at 27, and Nashville, Tenn., at 28. The highest days on market averages were in Augusta, Maine, at 108, and Burlington, Vt., at 89. Days on market is the number of days between when a home is first listed in an MLS and a sales contract is signed.
Months Supply of Inventory
The number of homes for sale in October 2017 was down 6.3 percent from September 2017, and down 13.4 percent from October 2016. Based on the rate of home sales in October, the months supply of inventory decreased to 3.3 from September 2017 at 3.6, compared to October 2016 at 3.9. A 6.0-months supply indicates a market balanced equally between buyers and sellers. In October 2017, 50 of the 53 metro areas surveyed reported a months supply at or less than 6.0, which is typically considered a seller’s market. The metro areas that saw a months supply above 6.0, which is typically considered a buyer’s market, were Miami, Fla., at 7.3, Birmingham, Ala., at 6.8, and Augusta, Maine, at 6.5. The markets with the lowest months supply of inventory continued to be in the West, with San Francisco, Calif., at 1.0, Denver, Colo., and Seattle, Wash., at 1.3, and San Diego, Calif., at 1.8.
For more information, please visit www.remax.com.
For the latest real estate news and trends, bookmark RISMedia.com.