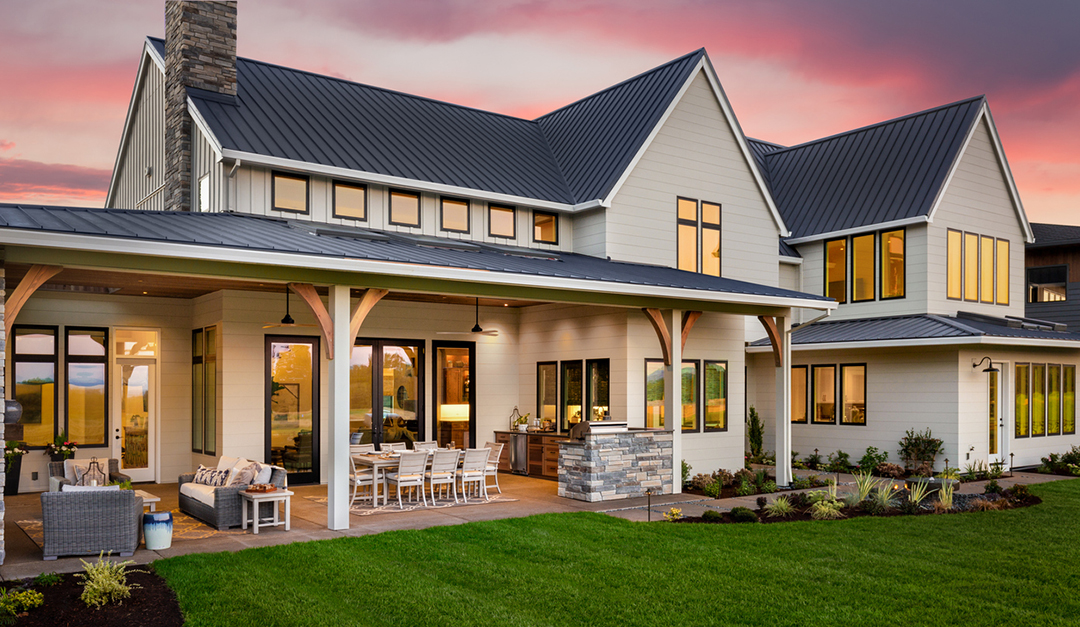
The one outlier for May’s housing activity amidst the pandemic? Luxury markets. While inventory remains tight like the rest of the market, according to realtor.com®’s Luxury Housing Report, the luxury markets performed well in May, all things considered.
Inventory rebounded from April’s historic declines, but is still low—million-dollar listings were down 15.6 percent YoY in May.
The pandemic did slow price growth, with only 25 of 96 luxury markets tracked by realtor.com® experiencing price increases since January. However, the luxury listing price point reached $2.97 million in May—a 0.5 percent increase from April and a 6.1 percent increase from the same time last year.
Demand for these homes also increased after searches fell 9.5 percent YoY in April. In May, searches for million-dollar homes increased by 7.3 percent YoY, outpacing the 6.2 percent growth pre-COVID.
There’s been renewed interest in some second-home luxury markets, particularly Suffolk County, N.Y.; Palm Springs, Calif.; and Greenwich, Conn., all of which ranked among the top five markets with the largest increase in listing view growth in May. Views of luxury properties increased 56 percent in The Hamptons, 28 percent in Palm Springs and 24 percent in Greenwich since January.
Because New York was the epicenter of the coronavirus outbreak early on, luxury buyers focused on the dense urban setting of the five boroughs, according to the report. Hampton listing views increased 72 percent in May YoY, and in the Union, Bergen and Somerset counties of New Jersey, they increased by 40, 30 and 28 percent, respectively. Still, activity in Manhattan, Brooklyn and Queens remained steady in May, a change from slight declines pre-COVID.
New York Metro Area Luxury Markets as Ranked by Views Per Property:
Suffolk, N.Y.
Million Dollar Homes – Views Per Property YoY: 72%
Luxury Listing Price (Top 5%): 5,950,000
Luxury Listing Price YoY: 8.2%
Union, N.J.
Million Dollar Homes – Views Per Property YoY: 40%
Luxury Listing Price (Top 5%): 1,460,000
Luxury Listing Price YoY: 0.7%
Bergen, N.J.
Luxury Listing Price YoY: 30%
Luxury Listing Price (Top 5%): 2,539,000
Luxury Listing Price YoY: 6.3%
Somerset, N.J.
Million Dollar Homes – Views Per Property YoY: 28%
Luxury Listing Price (Top 5%): 1,695,000
Luxury Listing Price YoY: -5.6%
Ocean, N.J.
Million Dollar Homes – Views Per Property YoY: 19%
Luxury Listing Price (Top 5%): 1,750,000
Luxury Listing Price YoY: 25.1%
Monmouth, N.J.
Million Dollar Homes – Views Per Property YoY: 18%
Luxury Listing Price (Top 5%): 2,500,000
Luxury Listing Price YoY: 0.0%
New York, N.Y.
Million Dollar Homes – Views Per Property YoY: 18%
Luxury Listing Price (Top 5%): 12,500,000
Luxury Listing Price YoY: 14.9%
Morris, N.J.
Million Dollar Homes – Views Per Property YoY: 15%
Luxury Listing Price (Top 5%): 1,600,000
Luxury Listing Price YoY: -3.6%
Westchester, N.Y.
Million Dollar Homes – Views Per Property YoY: 10%
Luxury Listing Price (Top 5%): 3,395,000
Luxury Listing Price YoY: 0.0%
Kings, N.Y.
Million Dollar Homes – Views Per Property YoY: 10%
Luxury Listing Price (Top 5%): 3,750,000
Luxury Listing Price YoY: 13.2%
Nassau, N.Y.
Million Dollar Homes – Views Per Property YoY: 2%
Luxury Listing Price (Top 5%): 2,799,000
Luxury Listing Price YoY: 1.8%
Hudson, N.J.
Million Dollar Homes – Views Per Property YoY: -7%
Luxury Listing Price (Top 5%): 1,800,000
Luxury Listing Price YoY: 11.2%
Queens, N.Y.
Million Dollar Homes – Views Per Property YoY: -22%
Luxury Listing Price (Top 5%): 1,699,000
Luxury Listing Price YoY: 0.0%
“The COVID-19 pandemic has reinforced the resilience of the housing market and unlike prior downturns, the luxury market is leading the recovery,” said realtor.com®’s Chief Economist, Danielle Hale. “Stay-at-home orders and social distancing have put a new value on the extra space. We’re seeing this in the luxury market as well, which could mean there is renewed interest from high-end buyers to find a second-home that is within driving distance from their primary residence.”
For more information, please visit www.realtor.com.


