CoreLogic® recently released its latest Single-Family Rent Index (SFRI), which analyzes single-family rent price changes nationally and across major metropolitan areas. November 2020 data shows a national rent increase of 3.7 percent year-over-year, up from a 2.8 percent year-over-year increase in November 2019. Annual rent growth slowed in the early months of the pandemic—from February through June—but then steadily picked up in November, which was the highest annual growth since June 2016.
In 2020, the rental vacancy rate on one-unit homes fell to its lowest level since 1994, contributing to increases in rent prices. While single-family inventories fell at all price tiers, the lowest-priced rentals fell the least, which is reflected in its underperformance compared to other price levels. Rent price growth among lower-priced rentals has lagged for most of the pandemic, and in November, remains the only tier to trail last year’s levels. However, the recent uptick in employment growth has helped this tier’s trend towards a recovery in the fall, with price growth drawing closer to its year-ago levels. Should these factors hold, we may expect to see low-end rent price growth return to pre-pandemic levels like the other tiers.
“Rent increases for single-family properties rebounded in recent months and in November exceeded the pre-pandemic rate,” said Molly Boesel, principal economist at CoreLogic. “This is in contrast to rents for multifamily properties, which have decreased as tenant preferences shifted away from high-density apartment buildings to low-density, single-family homes.”
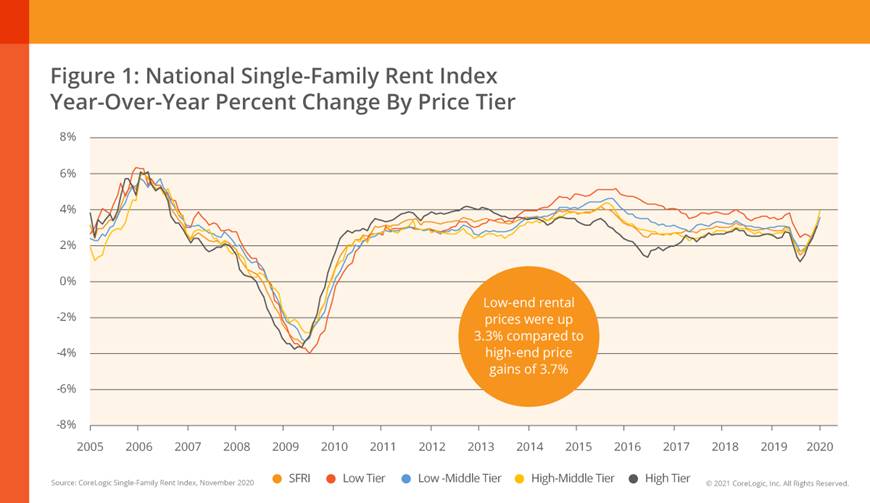
To gain an accurate view of single-family rental prices, CoreLogic examines four tiers of rental prices. In November 2020, three price tiers surpassed their pre-pandemic levels. The national single-family rent growth across the four tiers, and the year-over-year changes, were as follows:
Lower-priced (75 percent or less than the regional median): 3.3 percent, down from 3.6 percent in November 2019, but up from 2.5 percent in September and 3.1 percent in October 2020
Lower-middle priced (75 percent to 100 percent of the regional median): 3.6 percent, up from 3 percent in November 2019
Higher-middle priced (100 precent to 125 percent of the regional median): 4 percent, up from 2.7 percent in November 2019
Higher-priced (125 percent or more than the regional median): 3.7 percent, up from 2.5 percent in November 2019
Among the 20 metro areas shown in Table 1, and for 24 consecutive months, Phoenix had the highest year-over-year increase in single-family rents in November 2020 at 9.9 percent. Tucson, Ariz., had the second-highest rent price growth with a gain of 8.9 percent, followed by Las Vegas at 6.2 percent. Conversely, Boston posted an annual decline in rent prices of 4.6 percent. Boston has experienced the largest decrease in all analyzed metros’ rent prices for four consecutive months, likely due to the decreased number of college students moving to the city, opting instead to continue classes virtually from their hometowns.
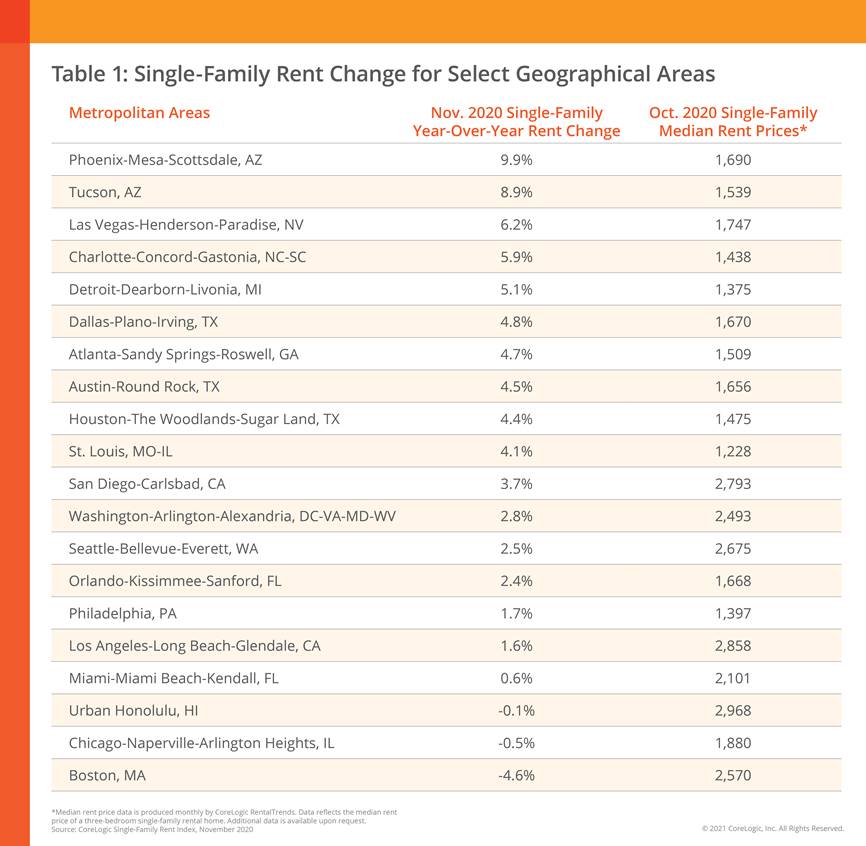
Employment rates continue to fluctuate across the country, with some regions and metros experiencing higher job loss rates than others. Still, as employment slowly improves, the rental market likewise continues to stabilize. For example, Honolulu employment decreased 13.3 percent compared to November 2019, a 2 percentage-point improvement over October 2020’s employment loss, and only posted a 0.1 percent decline in single-family rent prices, compared to a 0.4 percent decline in October. Phoenix had a relatively mild employment decrease of 2.6 percent compared to November 2019 and experienced a 9.9 percent growth of rental prices. As the economy recovers from the pandemic’s impact, we may see rent prices rise in metros across the nation.
For more information, please visit www.corelogic.com.