Housing affordability and equality are both historical and ongoing challenges. Two papers from the Joint Center for Housing Studies track how public organizations have used digital data and derived new models from said data in an effort to address these challenges throughout North American metropolitan areas.
Housing affordability and digital planning
The first of these papers, “Data-Driven Multi-Scale Planning for Housing Affordability” by Arezoo Besharati and Paul Waddell, focuses on simulation programs used to evaluate and project housing changes in Canadian metropolitan areas.
The paper highlights a partnership with Canada Mortgage and Housing Corporation, a state-owned entity tasked by Parliament with ending homelessness and housing unaffordability by 2030, and UrbanSim Inc., specializing in digital 3D urban maps for use by developers.
One of the partnership’s goals in collecting data is to streamline communication between the numerous entities (housing developers, provincial governments, etc.) and develop “data-driven support planning tools”—but the relied-upon data needs to be up to date. As the paper stresses, zoning is fundamentally a local regulation, and this lack of universality can be an impediment to communication. Likewise, local zoning data can and often does have lapses in it as the responsibility of collection falls on local entities. This actually makes nationwide data all the more important, for it can be “fine-tuned on local slices.”
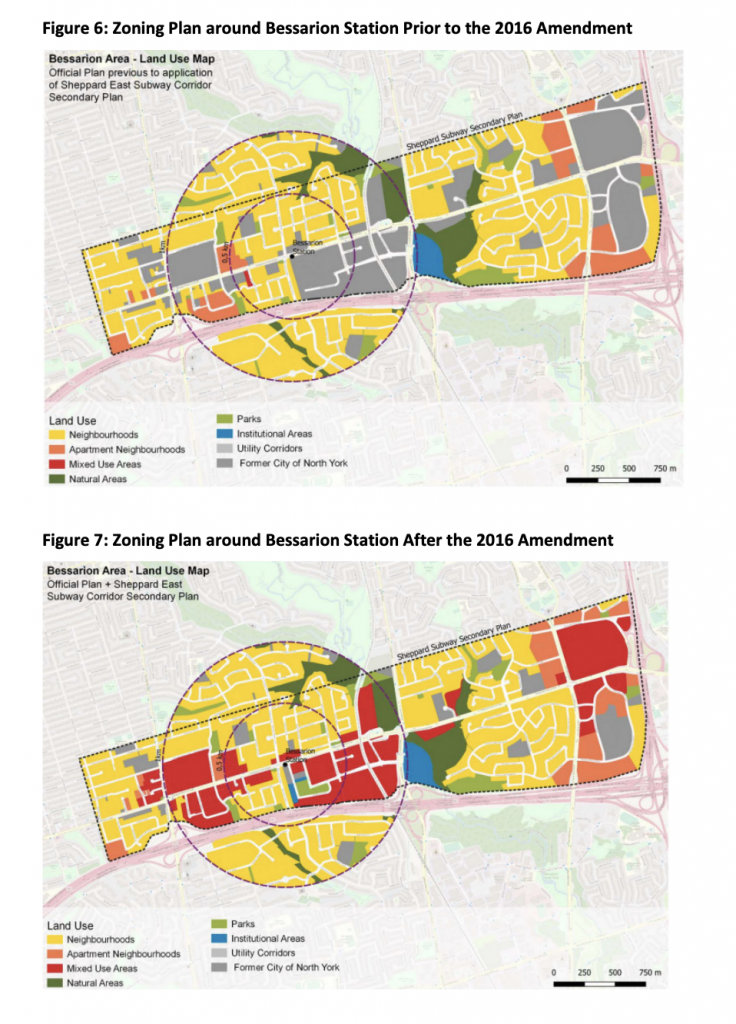
As for housing affordability, that’s where longitudinal data comes into play. By projecting changes to a metropolitan area with the UrbanSlim model, based on factors relevant to household and employment status, changes and contingent factors can be tracked. For verification, users can adjust these outcomes, and the simulated outcomes are compared to the actual outcomes. The paper includes the results of a simulation tracking how zoning changed around Bessarion train station in Toronto from 2006 to 2016 (the presence of public transit is an important factor in determining housing affordability).

The paper ultimately recommends a “unified platform” that, in the vein of these simulations, combines data collection and analytics, and is available to both public and private sector actors. While housing changes physically unfold at a local level, making them happen requires the coordination and accuracy that digital information can provide.
How data can reshape urban development
The second of these papers, “Creating Action With Data: Using Data to Increase Equity in Urban Development” authored by Justin Kollar, Niko McGlashan and Sarah Williams, spotlights how housing data can be used to reshape urban development toward equity.
At the paper’s outset, the authors note that data can and historically has been used to the opposite end. Specifically cited is the Home Owners Loan Corporation using data to redline maps and reinforce social barriers with physical segregation. However, the paper in turn argues that data can just as easily expose inequity or measure the success of equity-driven programs; it’s a matter of how the information is used.
The paper focuses on two programs, one in New York City and the other in Seattle. Part of the decision in highlighting these is to examine how a housing equity program designed by academics (NYC) compares to one designed by city planners (Seattle).
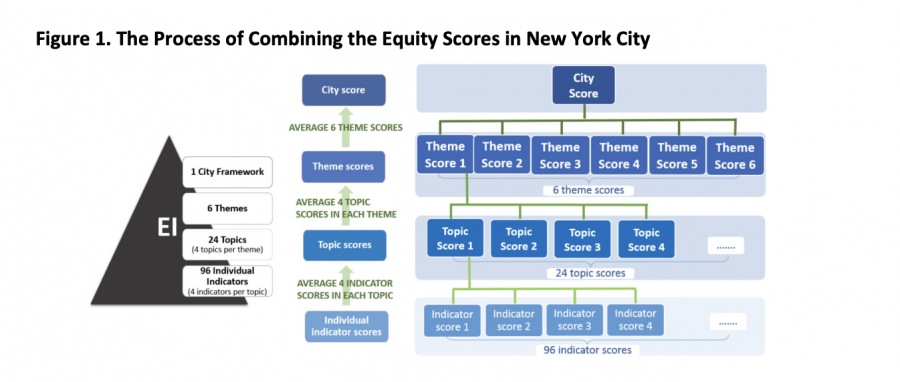
The CUNY Institute for State and Local Governance Equity Indicators Project focused its effort on creating “equity indicators” in neighborhoods. These were drawn from 96 metrics focused on gaps between the most and least advantaged
The explicit goal was to create a model transferable to other cities—the paper argues that this impeded the usefulness in addressing problems endemic or historical to New York City itself.

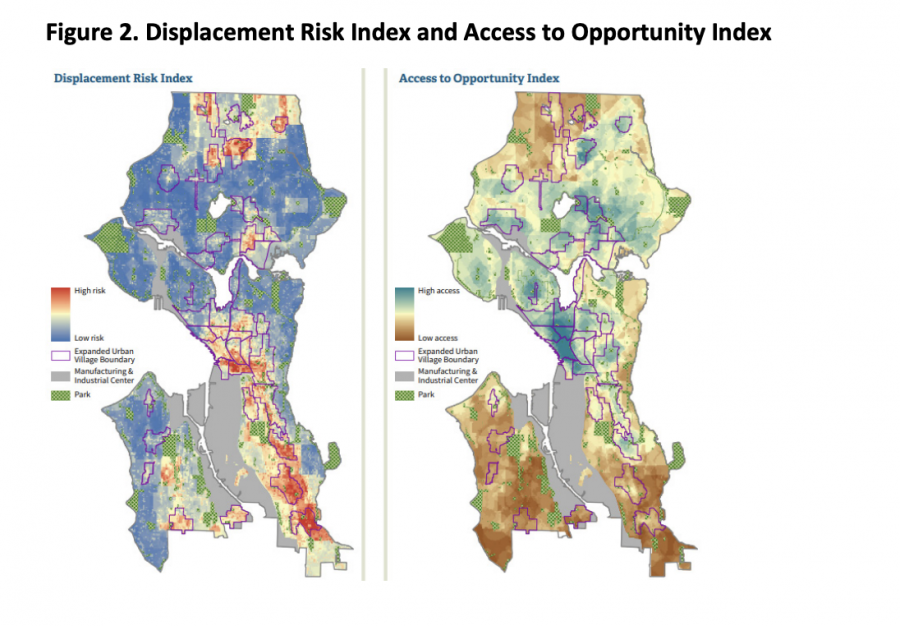
Seattle Equity Indicators and Action Planning designed two measures to tackle housing inequality: the Displacement Risk Index and the Access to Opportunity Index, measured by community and resident features (race, employment, schools in the area, etc.). When the Duwamish Valley was identified as an area in need of attention under these metrics, the city formulated the Duwamish Valley Action Plan.

The paper largely comes down in favor of the Seattle model, arguing its “city-scaled” approach is superior to CUNY’s standardized one. The findings being visualized as a map, the paper argues, also makes them more easily communicated as they rely less on internal methodology than the equity indicators.
At both the beginning and end of the paper, the authors stress four “themes” that summarize their conclusion:
- Building a proper team and engaging stakeholders is essential to defining “equity.”
- Data is biased—we must evaluate sources and their appropriateness for measuring equity.
- Data should be analyzed ingeniously and ground-truthed.
- Communicating results effectively can yield compelling insights.
Read the full reports here.


