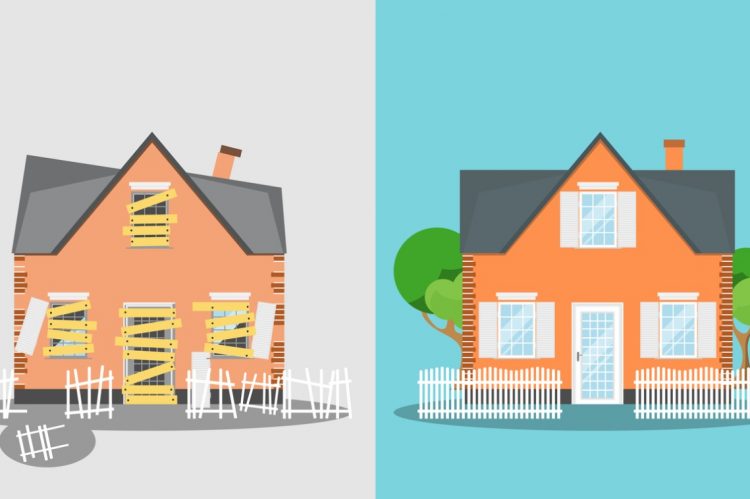
72,543 homes in the United States were flipped in the Q3, or one of every 14 home sales nationwide (7.2%), according to a new report from ATTOM.
ATTOM’s Home Flipping Report for Q3 2023 found that the latest reading was down from 7.9% of all home sales in Q2 and from 7.7% in Q3 last year. While the flipping rate remained historically high, the report found that it dropped for the second straight quarter to its lowest point in two years.
The report also found that the typical Q3 profit margin of 29.8% nationwide remained far below peaks hit in 2021, but it was up from 29% in Q2 2023 and up from a low of 22.4% in Q4 last year.
Key highlights:
- Home flips as a portion of all home sales decreased in 136 of the 183 metro areas around the U.S. with enough data to analyze (74%).
- Profits and profit margins again turned upward as investors were able to benefit from shifts in prices that went in their favor from the time when they were buying their properties to the point at which they sold them.
- Specifically, the typical resale price on flipped homes decreased to $305,000, a 1.5% decline from Q2 2023. But that drop-off was not as much as a 2.1% dip in median prices that recent home flippers were commonly seeing when they were buying their properties. The smaller quarterly decline in resale prices led to the improvement in profits and profit margins.
- The median $305,000 resale price of homes flipped generated a gross profit of $70,000 above the median investor purchase price of $235,000. That resulted in a typical 29.8% profit margin, up from 29% in Q2 and 27% in Q3 last year. But, the latest nationwide figure still remained far beneath the 60.8% level in Q2 2021.
- Raw profits on typical flips around the country, meanwhile, increased to $70,000. That remained well down from a high of $110,000 reached in 2021. But it was up slightly from the second quarter of 2023 and was $15,000 more than last year’s low point.
- Profit margins went up in 93 of the 183 metro areas analyzed (51%) and were up annually in 111 of those markets, or 61%.
- The highest raw profits on median-priced home flips, measured in dollars, were concentrated in the West and Northeast regions of the country. The South dominated the opposite end of the range, along with the West. Those two regions had 24 of the 25 worst raw profits on median-priced transactions.
- Nationwide, 62.9% of homes flipped had been purchased by investors with cash. That was up from 62.3% in Q2 2023, although still down from 63.7% in Q3 2022.
- Meanwhile, 37.1% of homes flipped had been bought with financing. That was down from 37.7% in the prior quarter, but still up from 36.3% a year earlier.
- The average time it took from purchase to resale on home flips dropped to 161 days. That was down from 178 in Q2 2023 and 165 days in Q3 2022, to the smallest level since Q4 2021.
Major takeaway:
“The comeback for the home-flipping industry is looking more like a real trend than a temporary break in what had been a pretty bleak couple of years,” said Rob Barber, CEO for ATTOM. “For sure, investment returns still aren’t anywhere close to where they were a couple of years ago. The latest nationwide profit margin also remains barely within the spread that covers the usual holding costs on flips, with wide variations around the country. Nevertheless, home flippers continue to head back in the right direction.”
For the full report, click here.


