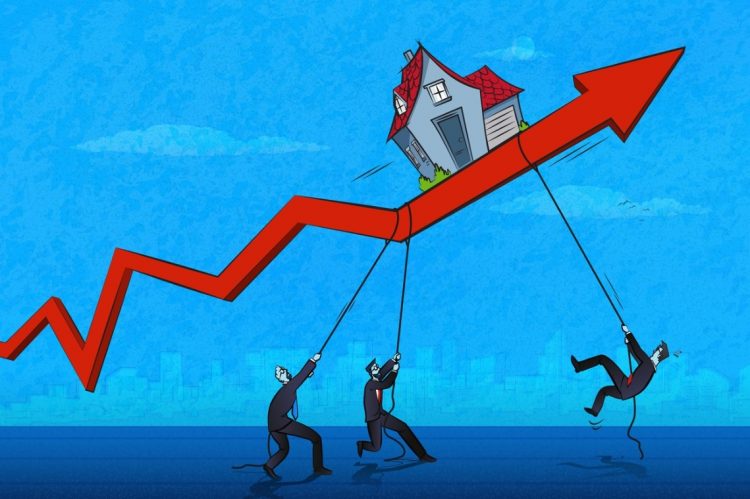
Despite recent positive economic developments—lowering mortgage rates below 7% and a second consecutive rate pause from the Fed—housing affordability continues to challenge Americans in Q4 2023.
ATTOM’s Home Affordability Report for Q4 2023 found that the typical $2,016 cost of mortgage payments on median-priced homes consume 33.7% of the average national wage of $71,708. That remains the same as in Q3, but is up from 30.9% in Q4 2022 and is far above the recent low point of 21.4% hit in Q1 2021.
Key highlights:
- After jumping almost 10% during this year’s Spring and Summer home-buying season, the national median price for single-family homes and condos has decreased from $344,670 in Q3 to $335,000. However, it is still up 6% from $316,000 in Q4 2022.
- The portion of average local wages consumed by major home-ownership expenses on typical homes is considered unaffordable in more than three-quarters of the 580 counties in the report.
- Year-over-year changes in average annualized wages have bested price movements in 286 of the 580 counties analyzed (49.3%).
- Amid interest rates ticking up but home values inching down, the portion of average local wages consumed by major expenses on median-priced, single-family homes has grown in just 54.7% of the 580 counties analyzed. However, it remains up annually in 88.8% of those markets.
- The top 20 counties where major ownership costs require the largest percentage of average local wages are again in the Northeast or the west coast.
- Annual wages of more than $75,000 are needed to pay for major costs on the median-priced homes purchased during the fourth quarter of 2023 in 332 (57.2%), of the 580 markets in the report. By contrast, just 11% of the counties reviewed have average annual wages that high.
- Looked at another way, the $86,404 income needed to afford a median-priced home is 20.5% more than the latest average national wage.
- Among the 580 counties analyzed, 572 (98.6%), are less affordable than their historic affordability averages. That is almost the same as the 98.8% level of a year ago but double the 48.7% figure from Q4 2021.
- Historical indexes have worsened since Q4 2022 annually in 88.8% of those counties, pushing the nationwide index to its lowest point since 2007.
- Only eight of the 580 counties in the report, (1.4%), are more affordable than their historic averages. That is about the same as in Q3, but less than the 12.1% level a year ago and far worse than the 51.3% that were historically more affordable in Q4 2021.
Major takeaway:
“The good news is that home affordability has stopped getting tougher around the U.S., at least for the moment. The bad news is that owning a home remains more of a financial stretch than it’s been for many years,” said Rob Barber, CEO for ATTOM. “The annual Fall slowdown in the housing market clearly has helped stem the tide working against potential purchasers. Whether that’s just a temporary thing tied to seasonal market patterns is something we won’t know until next year, especially given recent signs that interest rates are coming down. But for now, there is some break into the growing financial stress for house hunters.”
Barber continued, “This remains among the most important bits of fallout from the double-whammy of higher prices and mortgage rates over the past few years. Even though there are signs of better times for buyers this quarter, the high expense-to-wage ratio is still a stretch in most of the country for average workers who don’t have a lot of other financial resources like significant savings or investments. Lenders will often push the 28 percent rule, especially if buyers have lots of financial resources outside of wages, we now are seeing fully three-quarters of markets around the country pushing the basic lending benchmark.”
For the full report, click here.


