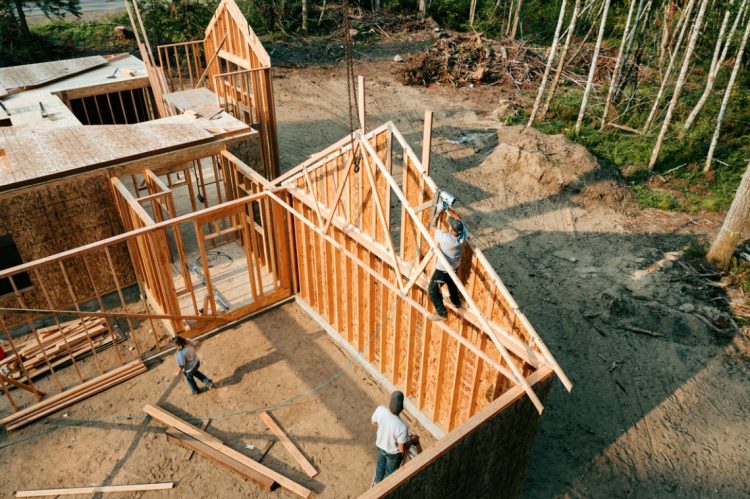
This year kicked off with a downturn in construction—seasonally adjusted, there were only 1,366,000 privately-owned housing starts in January, 9.8% lower than the number of starts from December 2024.
These numbers come courtesy of the latest report from the U.S. Department of Housing and Urban Development (HUD) and the U.S. Census Bureau. The January 2025 housing starts, though a sharp monthly decline, were only 0.7% lower than the number of starts reported in January 2024 (1,376,000). Single-family housing starts, which stood at 993,000 in January 2025, were also 8.4% lower than the December figures.
Building permits stood at a seasonally adjusted annual rate of 1,483,000 in January 2025. This is a negligible change (0.1% higher) compared to December 2024 and a slight decline (1.7%) from January 2024.
Joel Berner, senior economist at Realtor.com®, described the permit results as “first place where we see some uncertainty about the future affecting builder decisions.”
Berner proposed that the large gap between housing starts and housing completions (1,651,000) in January suggested “that builders are in wait-and-see mode when it comes to kicking off new residential construction projects,” due to ongoing concerns about inflation and proposed tariffs by the Trump administration.
Also citing low existing-home sales during 2024 (the lowest since 1996) but specific strength for new-home sales, Berner described the current mood of builders as pessimistic, or at least cautious, about the near future of the housing market but with some optimism about its current state.
The National Association of Home Builders (NAHB) attributed the decline of housing starts to “elevated interest rates” and ongoing unaffordability.
In a press release, NAHB Chairman Carl Harris described the results as consistent with the association’s own builder survey.
“High construction costs, elevated mortgage rates and challenging housing affordability conditions are causing builders to approach the market with caution. The uncertain policy environment in terms of a better regulatory climate and impending tariffs offers both upside and downside risks in the near-term,” said Harris.
“Given persistent affordability concerns, reducing inefficient regulatory costs would offer the best policy path to improve attainable housing supply and bring down shelter inflation,” argued NAHB Chief Economist Robert Dietz in the same release.
Regional breakdown of housing starts
After previously seeing the highest increases in housing starts back in December 2024, the Northeast reversed course and posted the largest seasonally adjusted declines in housing starts during January 2025. Northeast starts fell by 21.1% compared to December 2024 and by 27.6% compared to January 2024. Single-family starts in the Northeast also declined by 14.5% (monthly) and by 23.2% (annually).
The South also posted seasonally adjusted declines, but more so month-to-month, with housing starts dropping 23.3% monthly and 9.8% annually. Southern single-family starts dropped 19.2% monthly and 10% annually.
The Midwest saw monthly seasonally adjusted declines in housing starts, but strong annual increases: Midwestern starts dropped monthly by 10.4% but increased annually by 30.2%. Single-family starts dropped monthly by 9.2% but rose 23.2% annually in the Midwest.
The West was the only of the four census regions that posted consistent seasonally adjusted increases in housing starts during January 2025—the region saw 42.3% more housing starts in January 2025 compared to December 2024, and 14.3% more compared to January 2024. Single-family starts in the West were 24.9% higher monthly and 12.0% higher annually.
Regional breakdown of building permits
The number of building permits issued in the Northeast during January 2025 was, seasonally adjusted, 6.1% lower than both December 2024 and January 2024. Single-family home permits in the Northeast were down 1.6% monthly but up 3.4% annually.
The Midwest saw the greatest seasonally adjusted increases in building permits, both monthly and annually; all permits were up 1.8% compared to December 2024 and up 4.7% compared to January 2024. Single-family home permits were up 5.5% monthly and 8.9% annually in the Midwest.
The South saw a seasonally adjusted 0.1% monthly drop in permits, but a 0.8% increase annually. Single-family permits in the South were down more noticeably, monthly by 3.9% and annually by 5.9%.
In the West, permits were up 2.3% monthly but down 9.2% annually—single-family permits were up 8% monthly but down 5% annually by a seasonally adjusted rate.
For the full report, click here.


