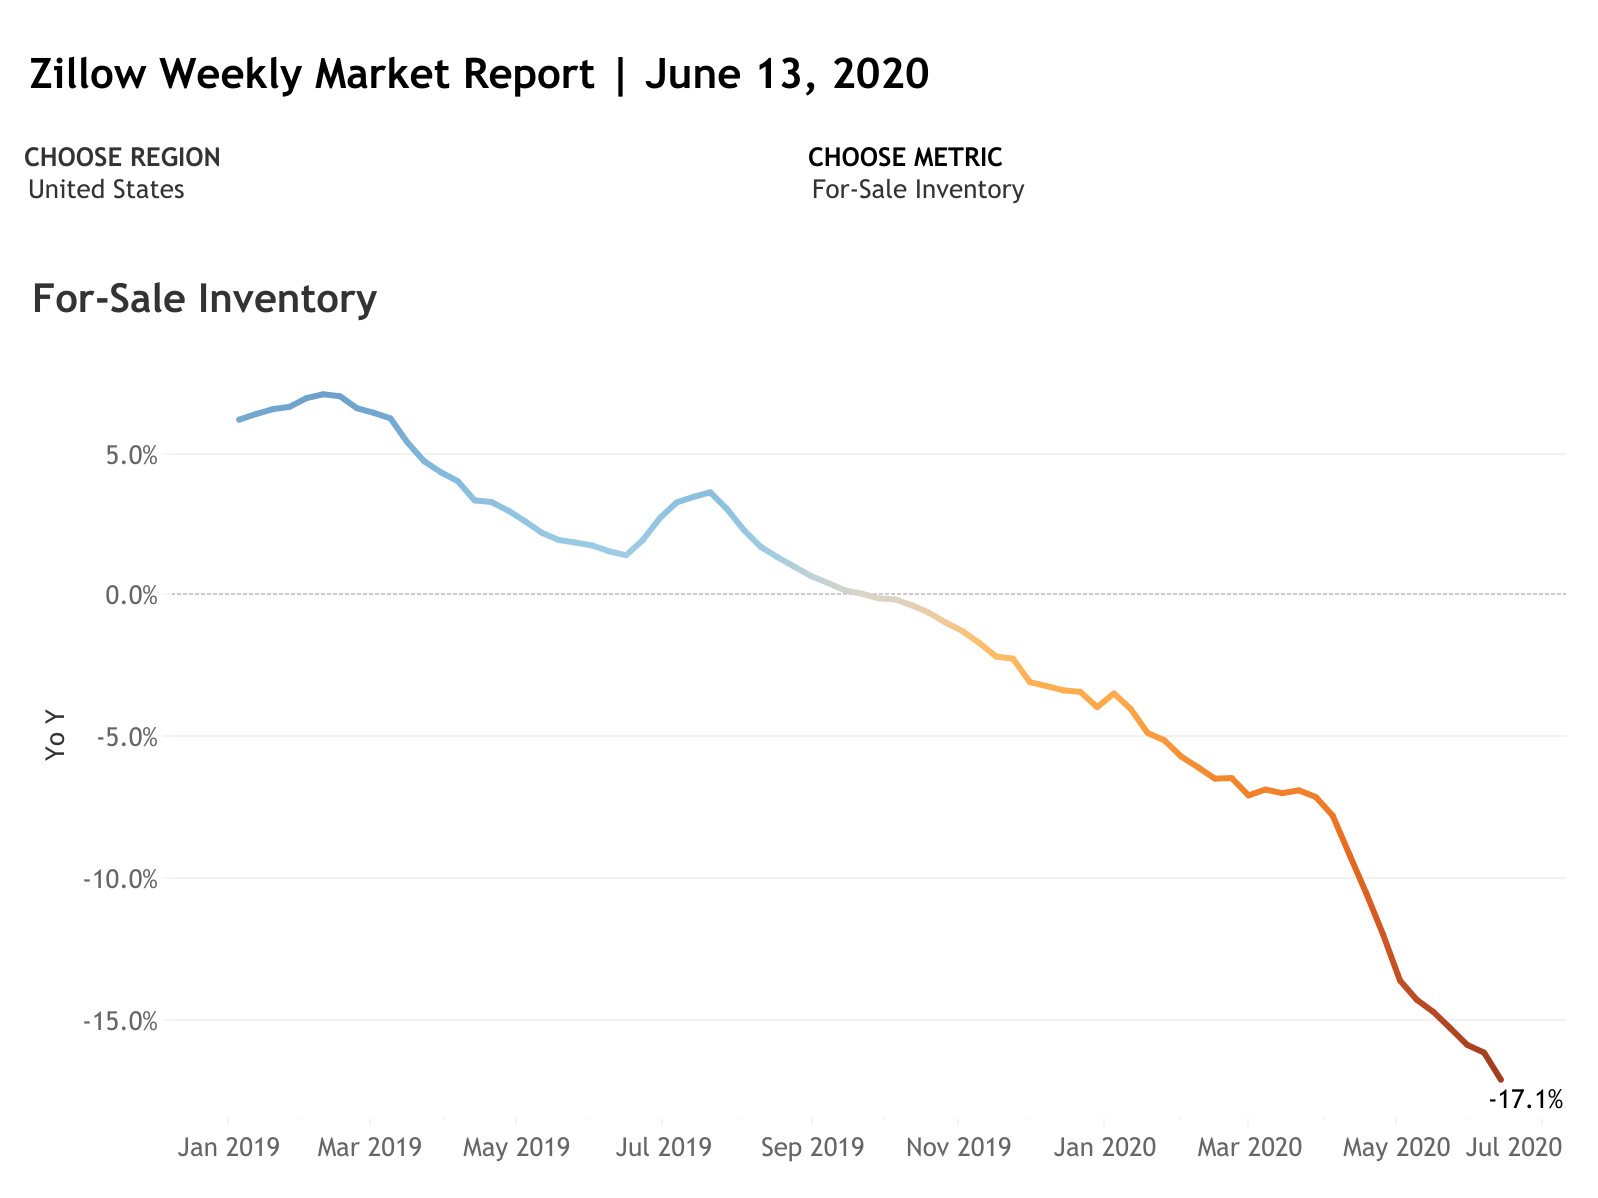
Zillow’s latest Weekly Market Report shows homebuyer demand continued to grow for the week ending June 13. In addition, newly pending sales increased from the previous week, but the inventory shortage continues—new and total listings both fell.
Here’s the Breakdown:
Pending Home Sales
Newly pending sales increased, growing 2.8 percent WoW and 17.7 percent MoM. Newly pending sales grew the most in the following of the largest 35 U.S. metros: Philadelphia (62.7 percent MoM), New York (58.1 percent MoM) and Miami (37.9 percent MoM)
Inventory
Total for-sale inventory decreased 0.5 percent from the previous week—17.1 percent below last year’s level. New listings are up 13.9 percent MoM, but 3.8 percent fewer came onto the market from the previous week. Overall, new listings are down 16.6 percent YoY.
List Prices
The median list price increased 2.5 percent YoY and 0.8 percent from the previous week—currently $332,680. Zillow expects prices to drop 1.8 percent from April to October 2020, with a steady recovery through 2021.

Breakdown by Top Metro Area:
New York, N.Y.
Newly Pending Sales (MoM): 58.1%
Newly Pending Sales (WoW): -1.6%
Total For-Sale Listings (YoY: -27.4%
New For-Sale Listings (YoY): -6.1%
New For-Sale Listings (MoM): 57.8%
Median List Price (YoY): 2.2%
Los Angeles-Long Beach-Anaheim, Calif.
Newly Pending Sales (MoM): 33.9%
Newly Pending Sales (WoW): 7.6%
Total For-Sale Listings (YoY): -25.7%
New For-Sale Listings (YoY): -12.5%
New For-Sale Listings (MoM): 13.9%
Median List Price (YoY): 6.5%
Chicago, Ill.
Newly Pending Sales (MoM): 31.2%
Newly Pending Sales (WoW): 4.8%
Total For-Sale Listings (YoY): -20.3%
New For-Sale Listings (YoY): -9.3%
New For-Sale Listings (MoM): 29.8%
Median List Price (YoY): -2.8%
Dallas-Fort Worth, Texas
Newly Pending Sales (MoM): 14.3%
Newly Pending Sales (WoW): 2.9%
Total For-Sale Listings (YoY): -7.8%
New For-Sale Listings (YoY): -13.5%
New For-Sale Listings (MoM): 6.4%
Median List Price (YoY): -2.4%
Philadelphia, Pa.
Newly Pending Sales (MoM): 62.7%
Newly Pending Sales (WoW): 3.4%
Total For-Sale Listings (YoY): -34.3%
New For-Sale Listings (YoY): -6.9%
New For-Sale Listings (MoM): 37.1%
Median List Price (YoY): 10.9%
For more information, please visit www.zillow.com.


