Pending home sales and new listings have been steadily growing stronger over the past several weeks. For the week ending May 30, however, the markets experienced a dip, likely due to the Memorial Day holiday weekend—historically, a norm as reported by Zillow’s Weekly Market Report. Zillow expects the market rebound to continue.
Here’s the Breakdown:
Pending Homes Sales
New pending home sales decreased 5.2 percent from the previous week, a drop possibly driven by Memorial Day weekend, according to Ziilow. Last year, pending home sales were down 7.1 percent WoW.
This marks the first week newly pending home sales turned negative since April 15. Month-over-Month, however, newly pending sales increased 24.5 percent, with positive numbers reported across America’s top 35 metros.
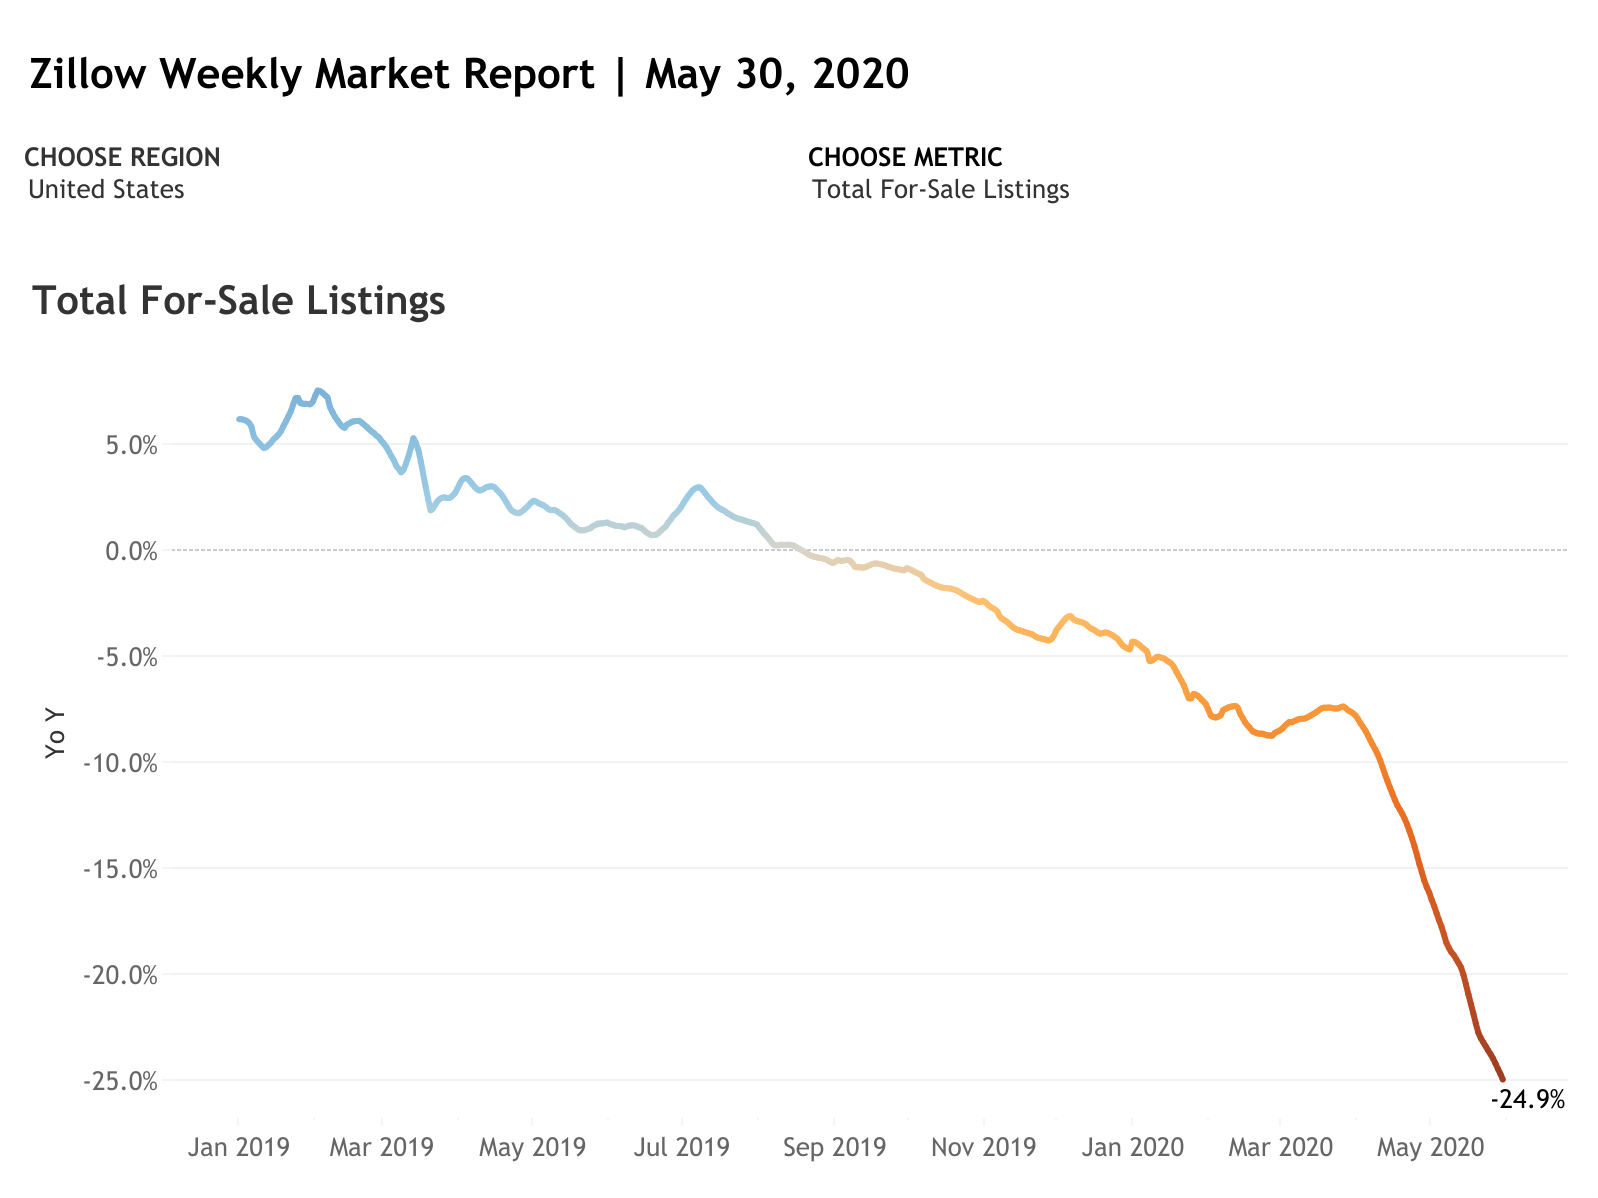
Inventory
Since the previous month, new listings were up 19.3 percent. Week-over-week, however, new listings decreased 7.2 percent, down 17.2 percent YoY. Total inventory is down 24.9 percent YoY—the biggest gap in 2020 so far, according to Zillow.
List Prices
Home prices continue to rise. The median list price in the U.S. is $329,941—3.1 percent higher YoY, and up 0.3 percent WoW. In 29 of the top 35 U.S. metros, list prices are higher YoY.
Breakdown by Top Metro Area:
New York, N.Y.
Newly Pending Sales (MoM): 36.6%
Newly Pending Sales (WoW): -7.0%
Total For-Sale Listings (YoY: -31.8%
New For-Sale Listings (YoY): -24.1%
New For-Sale Listings (MoM): 52.0%
Median List Price (YoY): 3.3%
Los Angeles-Long Beach-Anaheim, Calif.
Newly Pending Sales (MoM): 55.0%
Newly Pending Sales (WoW): 12.8%
Total For-Sale Listings (YoY): -28.0%
New For-Sale Listings (YoY): -22.4%
New For-Sale Listings (MoM): 13.3%
Median List Price (YoY): 7.7%
Chicago, Ill.
Newly Pending Sales (MoM): 23.8%
Newly Pending Sales (WoW): -3.4%
Total For-Sale Listings (YoY): -26.6%
New For-Sale Listings (YoY): -12.3%
New For-Sale Listings (MoM): 25.8%
Median List Price (YoY): -3.0%
Dallas-Fort Worth, Texas
Newly Pending Sales (MoM): 28.2%
Newly Pending Sales (WoW): -2.9%
Total For-Sale Listings (YoY): -16.3%
New For-Sale Listings (YoY): -14.3%
New For-Sale Listings (MoM): -0.6%
Median List Price (YoY): -1.3%
Philadelphia, Pa.
Newly Pending Sales (MoM): 107.2%
Newly Pending Sales (WoW): 14.2%
Total For-Sale Listings (YoY): -36.8%
New For-Sale Listings (YoY): -2.5%
New For-Sale Listings (MoM): 60.9%
Median List Price (YoY): 6.7%
For more information, please visit www.zillow.com.