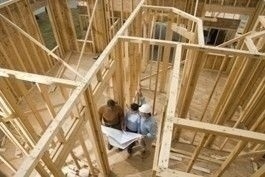
 Housing construction activity has increased significantly over the last year across the three primary sectors of home building: single-family, multifamily and remodeling. And that growth in turn means good news for those businesses that support residential construction, including building suppliers and other associated enterprises. While the NAHB forecast for this year calls for additional growth, there are likely to be monthly ups and downs along the way.
For example, Census construction spending data reported flat headline growth in January due to declines in the volatile remodeling spending category. Spending on new single-family homes continued to expand, rising 3.6 percent over December’s pace, while multifamily construction spending was up 1.7 percent. However, these gains were offset by a 4 percent drop in the improvement category. Nonetheless, total residential construction spending remains near post-2009 highs and has experienced growth in 15 of the last 17 months.
While construction activity has grown significantly over the last year, this improvement has not generated a surge in residential construction employment – yet. For January, in a generally positive jobs report that noted that the overall unemployment rate fell from 7.9 percent to 7.7 percent, the Bureau of Labor Statistics (BLS) indicated that the home building industry added more than 19,000 jobs. Since the point of peak decline of home building employment, 125,000 positions have been added to the residential construction sector.
And more hiring is on the way for the building industry. According to data from the Job Openings and Labor Turnover Survey (JOLTS) from BLS, the number of open positions in the construction sector has been trending up over the last six months. The January number, 98,000, is the second- highest number of unfilled positions in the last 17 months.
Additionally, analysis suggests that the NAHB/Wells Fargo Housing Market Index (HMI) is a leading indicator of home building employment. An NAHB statistical estimate based on the HMI and BLS employment data shows that a one-point increase in the HMI leads to an increase of about 18,700 jobs in residential construction 18 months later. And the employment effects of home building are broad-based—supporting jobs not only in construction, but also in the industries that manufacture building products, transport and sell building products, and provide broker, legal, accounting, architectural, engineering, and other professional services to builders and buyers. With the HMI up significantly over the last year, this suggests more job growth is on the way.
NAHB survey data points to more growth for the multifamily sector. The NAHB Multifamily Production Index (MPI) grew two points in the fourth quarter of 2012 to a level of 54. This marks the fourth straight quarter that the index has come in above the break-even level of 50. Furthermore, the NAHB Multifamily Vacancy Index (MVI) improved slightly, falling two points to 31. A declining MVI is good news because it indicates lower levels of apartment vacancies.
These numbers are generally consistent with fourth-quarter data from the Census Bureau’s Survey of Market Absorption of Apartments (SOMA), which tracks completions and rates of leased or sold multifamily units. The new SOMA data indicates that the completion of 5+ unit properties was up 20 percent in the third quarter over the same quarter in 2011. And the absorption rate is much improved over the Great Recession years, with the average three-month absorption rate over the last four quarters of reporting coming in at 60 percent.
These improving housing numbers are being shored up by generally positive fundamentals for the overall economy in the post-Fiscal Cliff period. The initial estimate from the Bureau of Economic Analysis of a 0.1 percent decline in economic growth for the fourth quarter of 2012 was revised up to an all-but-flat 0.1 percent growth rate. Nonetheless, most economists expect GDP growth to be significantly stronger during the first quarter of 2013, although the Sequester will hold those numbers back.
Anecdotal evidence from the Federal Reserve’s Beige Book is consistent with these forecasts. Ten of the 12 Federal Reserve Districts note that economic activity has recently expanded at a “moderate” or “modest” pace. Residential real estate markets are highlighted as improving in nearly all districts, with residential construction in particular noted as improving in 11 of 12 districts.
February also saw broad growth in consumers’ confidence. After mixed signals in January, both major indicators of consumer confidence rose, with Thomson Reuters and the University of Michigan measure up 5.1 percent in February. The Conference Board reported that its measure of consumer confidence rose by 19.2 percent for the month.
During the last quarter of 2012, household balance sheets improved with increases in home values and reductions in mortgage debt, thereby boosting household net worth. These are favorable improvements that will also help housing demand in 2013. The Fed’s Flow of Funds data show that since the first quarter of 2008, home mortgage debt has declined 11 percent, or $1.2 trillion. And the value of household real estate has now risen for the last four consecutive quarters for a total increase of $1.4 trillion.
While mortgage debt is down, other forms of consumer credit are rising. In fact, total household debt outstanding rose in the final quarter of 2010: the first time in two years, according to data from the Federal Reserve Bank of New York. Auto loans and credit card balances were both up, perhaps signaling future growth in consumer spending. However, student loan balances continued to rise, an impact of the housing crisis (less housing wealth available for parents to help finance college education) and a future negative effect on housing demand.
Ongoing problems with acquisition, development and construction (AD&C) loans continue to hold back a more robust expansion of home building, although conditions continue to improve. According to an NAHB industry survey, builders and developers continue to report that AD&C credit is improving slightly, with two consecutive quarters of data indicating the availability of credit for construction is improving. In particular, for the fourth quarter, 11 percent of respondents indicated that credit availability for single-family construction had deteriorated, while 29 percent noted that it had improved.
For land acquisition and development, NAHB members were closer to evenly split on whether credit conditions had improved or gotten worse. In fact, a significant gap has opened between development and construction loan conditions, with development loans faring worse. For this reason, it is not a surprise that the cost and availability of developed lots is a growing concern for builders.
Data from the FDIC is generally consistent with the NAHB survey results. While the outstanding stock of AD&C loans made by FDIC-insured institutions fell by $1.1 billion during the final quarter of 2012 (i.e. the retirement of old debt exceeded the issuance of new debt by $1.1 billion), the data marks five consecutive quarters of the outstanding stock of residential AD&C loans standing in the range of $42 billion to $44 billion. This result suggests lending conditions are stabilizing. However, there remains a significant lending gap between the demand for building and development and available AD&C funds, particularly as housing starts grow.
Finally, NAHB analysis examined trends in the housing sector. The recent NAHB survey What Home Buyers Really Want finds that energy efficiency and home organization features top the list. Survey data also suggest that most builders and remodelers use various forms of information technology more for managing internal operations relative to interacting with customers. But with respect to improving sales, builders who have online, downloadable brochures and feature the benefits of new construction generate more business. Finally, an analysis found that the top-10 home builder share remained approximately constant in 2012 compared to the previous year, at a market share of 23.9 percent of all single-family home sales.
To view this original post on NAHB’s blog, Eye on Housing, click here.


