 A previous blog post illustrated that U.S. house prices are recording a range of annual gains with some areas of the country rising faster than others. Similarly, in the context of the global economy, annual house price growth in the U.S. has been faster than some countries while lagging other countries.
The International Monetary Fund’s Global Housing Watch calculates a real seasonally adjusted house price index for 52 countries including the United States. House prices in these countries are used to calculate two separate global house price indexes. One global house price index assigns an equal weight to each country and the second global house price index is adjusted to account for the size of each country’s economic output (GDP).
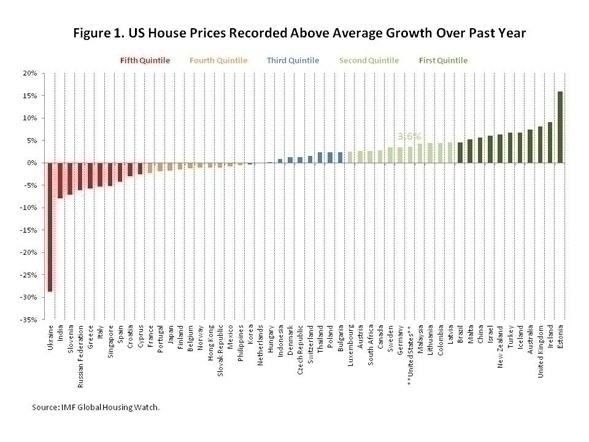
Figure 1 below shows that the rate of growth recorded in the US places it in the 2nd quintile amongst countries for which house price data are available. According to the International Monetary Fund, real and seasonally adjusted annual house price growth in the U.S. was estimated to be 3.6% between the second quarter of 2013 and the second quarter of 2014, thereby contributing to the 1.3% increase in real seasonally adjusted global house prices. The IMF comparison utilizes the Federal Housing Finance Agency (FHFA) house price index.

Earlier blog posts have illustrated how, typically, house prices in areas that fell the most remain farther from their peak level.
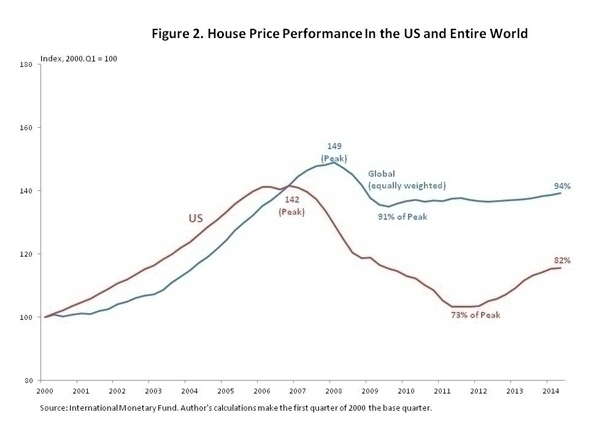
Similarly, in an international comparison, real seasonally adjusted house prices in the U.S. fell more than collective world house prices, but they are farther from returning to their peak level. As Figure 2 illustrates, house prices in the U.S. reached their peak in the fourth quarter of 2006 and fell to 73% of that peak by the second quarter of 2011. As of the second quarter of 2014, U.S. house prices are at 82% of their pre-bust peak level. Meanwhile, global house prices, house prices peaked in the first quarter of 2008 and fell to 91% of that level in the second quarter of 2009. However, as of the second quarter of 2014, global house prices are at 94% of their peak level.

View this original post on the NAHB blog, Eye on Housing.


