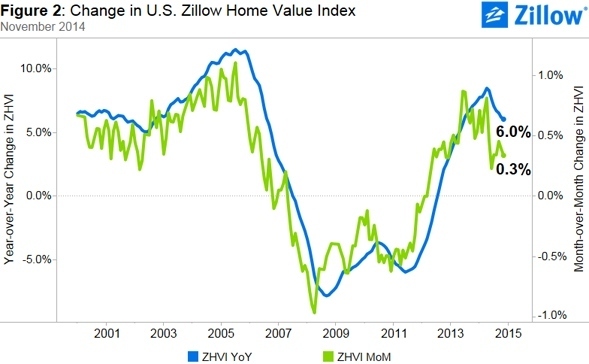
 The housing market received both good and bad news as of late; the good news is that America’s housing stock is now worth $27.5 trillion, an increase of $1.7 trillion over last year. The bad news is that U.S. home values rose 6 percent year-over-year through November, the smallest annual gain since June 2013, according to Zillow’s Stan Humphries.
The aggregate value of all homes nationwide is expected to be approximately $27.5 trillion by year’s end, up more than $1.7 trillion (6.7 percent) year-over-year and the third consecutive annual increase. It is a testament to just how huge and important the housing sector is to the overall economy that gains of more than a trillion dollars in one year represents only single-digit percentages of the total market. Humphries says.
Still, as massive as the current overall value of housing is in the U.S., the aggregate value of all homes remains 6.1 percent below the Q3 2006 peak of almost $29.3 trillion. This makes sense, as the median home value nationwide is still down almost 10 percent from its pre-recession high.
But just as median home values in several local markets across the country – including Denver, Pittsburgh and a handful of Texas metros – have exceeded their prior peaks, so too have aggregate home values in a few large markets. In nine of 35 largest metro areas covered by Zillow, the total value of all homes in the area is at or above prior peak. Many of the same areas where median home values are above peak are also the same as where aggregate values are at peak, including Denver and a collection of Texas markets (Dallas, Houston and Austin).
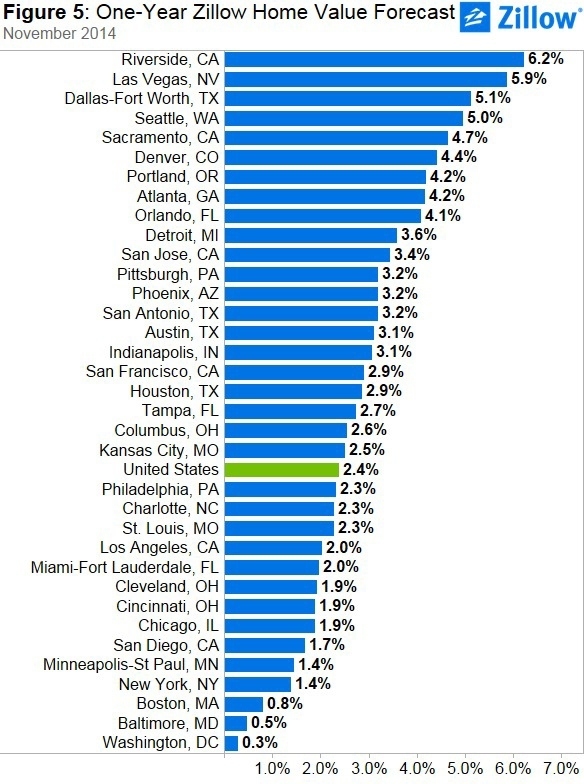
Although home values to continue to grow, they are rising much more slowly than earlier in the year, currently at a pace last seen in mid-2013. Over the next 12 months, from November 2014 to November 2015, home values are predicted to rise 2.4 percent, to slightly less than $182,000.
Slowing home value appreciation has been driven in large part by more for-sale inventory coming on line in recent months, which is helping to bring the supply of homes in line with demand. This has been welcome news for buyers that were previously competing with each other and with cash-rich investors for a very limited number of homes. However, inventory has been drifting downward on a monthly basis for the past two months.

Home Values
The November Zillow Real Estate Market Reports cover 522 metropolitan and micropolitan areas. In November, 392 (75 percent) of the 522 markets showed monthly home value appreciation, and 434 (83 percent) saw annual home value appreciation. Among the 35 largest metro areas covered by Zillow, 34 experienced annual home value appreciation. Overall, national home values remain 9.6 percent below the market’s April 2007 peak.
Areas with the largest annual gains in home values in November included Miami (13.6 percent), Atlanta (12.8 percent), Houston (11.9 percent), Orlando (11.9 percent) and Las Vegas (11.5 percent).
Currently, U.S. rents are up 3.4 percent year-over-year, according to the Zillow Rent Index (ZRI), which covers 864 metropolitan and micropolitan areas and the nation as a whole. Rents rose year-over-year in 654 markets (75.7 percent). Large markets that saw extremely strong annual rent appreciation include San Francisco (15.5 percent), San Jose (15.2 percent), Denver (10.1 percent), Kansas City (8.3 percent) and Austin (7.7 percent).
As rents continue to rise, rental affordability will continue to suffer. In the third quarter, renters making the national median income could expect to pay 29.9 percent of their monthly income to rent the typical U.S. property, well above the 24.9 percent they would have paid in the pre-bubble period from 1985-1999. Continuously rising rents nationwide could drive more people into the home-buying market, attracted by stable monthly payments and cheap financing because of low mortgage rates, but they also make it more difficult for potential first-time buyers (and current renters) to save for a down payment.
In general, national for-sale inventory levels remain below peak levels, though they have been higher in 2014 compared to 2013. In November, U.S. inventory of for-sale homes grew year-over-year by 11.8 percent. Inventory rose on an annual basis in 464 of 641 metro areas (72 percent). But inventory has drifted downwards on a monthly basis for the last two months, falling 1.7 percent nationwide in November from October.
Of the largest 35 metro areas covered by Zillow, 25 of 35 saw annual gains in for-sale inventory, while 30 of 35 saw monthly declines. In 20 of the largest 35 metro areas, inventory both rose annually and fell on a monthly basis. The metro areas seeing the largest annual changes in inventory were Riverside (42.6 percent), Orlando (40.2 percent), Sacramento (37.4 percent), Washington (35.4 percent) and San Diego (33.2 percent). Areas with the largest monthly declines in inventory were San Jose (down 11.8 percent), Denver (down 9.8 percent), San Francisco (down 7.9 percent) and Seattle (down 5.5 percent).
Foreclosures
The rate of homes foreclosed continued to decline in November, with 4.2 out of every 10,000 homes in the country being liquidated. This number is down from 5.2 homes one year ago. Nationally, foreclosure re-sales rose slightly, making up 8 percent of all sales in November, compared to 7.6 percent in October and 7.4 percent in November 2013. We expect the percentage of foreclosure re-sales to continue to increase slightly throughout the winter months, mainly due to overall seasonal declines in inventory.
Outlook
The housing market continues to recover and home values are predicted to continue to rise, but at a slower pace. Our forecast calls for another 2.4 percent appreciation from November 2014 to November 2015 for the nation, less than half the appreciation rate seen between
November 2013 and November 2014.
This slower pace will help bring more balance to the market, as more previously sidelined sellers decide to list their homes, and more buyers enter the market – particularly younger buyers. These buyers will find themselves with more leverage in the market, after years in which sellers largely held the upper hand in negotiations.
Out of the 35 largest metro areas covered by Zillow, we expect to see home values rise the most in Riverside (6.2 percent), Las Vegas (5.9 percent), Dallas (5.1 percent) and Seattle (5.0 percent). Both Las Vegas and Riverside are still over 30 percent down from peak home values, and have lots of room for home values to grow. Dallas is currently the most expensive it has ever been (nominally), while Seattle home values are down 11 percent from their August 2007 peak.

For more information, visit http://www.realestateeconomywatch.com.


