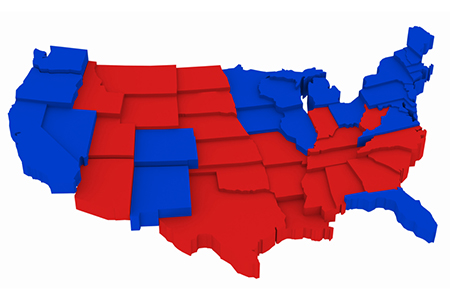
Party preference isn’t the only thing dividing red states and blue states. After applying the industry’s most accurate real estate valuations to every home in the U.S., HouseCanary found that there is also a significant and growing divide in residential real estate values between red states and blue states.
How big is the divide between residential real estate property values in red states (Republican) vs. blue states (Democrat)? We recently reviewed three decades of residential real estate data, comparing red states to blue states as projected for this election. Our findings uncovered the following stats:
Eighty percent of $6 trillion in property value creation went to blue states.
Since the last election in 2012, real estate has recovered from the deep recession, but the recovery was highly uneven. Of the $6 trillion in property value creation in the U.S. housing market, 80 percent went to blue states.
Seventy-seven percent of real estate value and wealth in the U.S. is in blue states.
Of the $27 trillion total residential real estate values in the U.S., more than $20 trillion is in blue states, and less than $7 trillion is in red states.
The three-year property value forecast shows a growing divide.
While growth is relatively even between red and blue states, blue state homes stand to increase in property value by nearly $40,000, compared to $20,000 for red states.
This was originally published on HouseCanary’s blog.
For more information, please visit www.housecanary.com.


