The latest FNC Residential Price Index™ (RPI) shows the nation’s housing market started the year with a small decline in average home prices. Based on recorded sales of non-distressed properties (existing and new homes) in the 100 largest metropolitan areas, the index fell 0.3% in January but continued to rise at a modest rate of 4.4% for its 31 consecutive months of year-over-year gains. As of January, the annual rate of price appreciation is at 10-month lows.
Completed foreclosures in January comprise about 15.5% of total existing home sales, up from 13.6% in December but down from 17.3% a year ago. In the for-sale market, the asking price discount and time-on-market are at 24-month highs. As of January, the median discount is 5.4% while the time-on-market is 133 days. Preliminary February estimates show signs of a modest increase in the average pace of home sales nationwide.
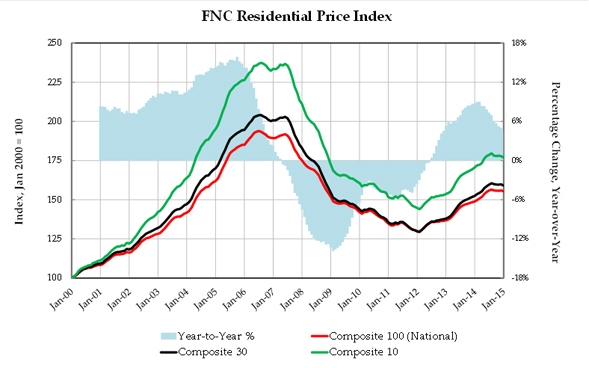
FNC’s RPI is the mortgage industry’s first hedonic price index built on a comprehensive database that blends public records of residential sales prices with real-time appraisals of property and neighborhood attributes. As a gauge of underlying home values, the RPI excludes final sales of REO and foreclosed homes, which are frequently sold with large price discounts, likely reflecting poor property conditions.
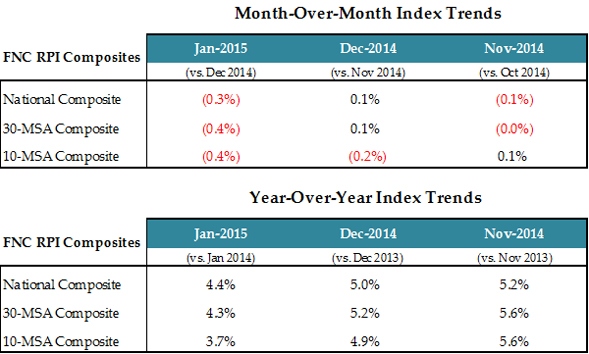
The table below shows the seasonally unadjusted rates of month-over-month and year-over-year changes in the FNC national index (a 100-MSA composite index) as well as 30- and 10-MSA composites. All three indices recorded a modest decline in January at a similar pace of 0.3-0.4%. The 10-MSA composite experienced the fastest decelerations in year-over-year growth, dropping more than one percentage point from 4.9% in December to 3.7% in January. The national and 30-MSA composites slid 0.6% and 0.9% respectively, dragging average home price appreciation down to about 4%.
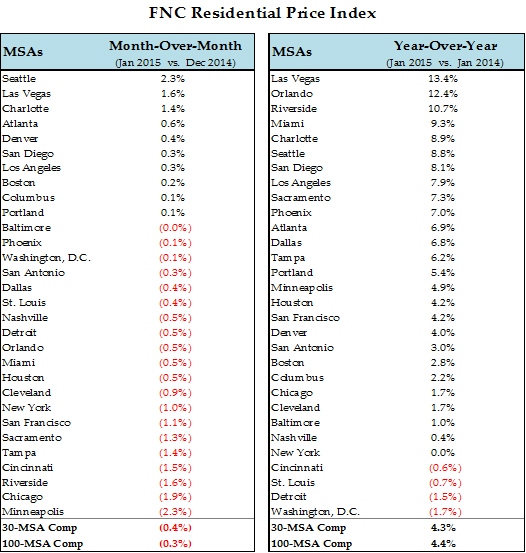
The chart below tabulates the month-over-month and year-over-year changes, showing the latest price trends for each MSA in the FNC Composite 30. Home prices are up in only 10 MSAs and are outnumbered by declining markets by 2 to 1. Seattle and Las Vegas showed the best performance, up 2.3% at 1.6% respectively, followed by Charlotte at 1.4%. In Las Vegas, home prices are at 36-month highs and have appreciated more than 63% during the last three years. Among the down-markets, Minneapolis and Chicago recorded the largest price decline at 2.3% and 1.9% respectively. Home prices in a number of other major cities also experienced modest declines: New York (1.0%), San Francisco (1.1%), Sacramento (1.3%), Tampa (1.4%), Cincinnati (1.5%), and Riverside-CA (1.6%).
As of the beginning of 2015, cities appreciating year-over-year at a double-digit rate are down to three–Las Vegas (13.4%), Orlando (12.4%), and Riverside (10.7%)–from a total of 15 a year ago. Despite the deceleration in housing activity in recent months, most major cities continue to show robust price growth, including Miami (9.3%), Charlotte (8.9%), Seattle (8.8%), San Diego (8.1%), Los Angeles (7.9%), Sacramento (7.3%), and Phoenix (7.0%). As of January, only Washington D.C., Detroit, St. Louis, and Cincinnati show a small decline from a year ago.
The hedonic procedures used to create the index are described in “Hedonic versus repeat-sales housing price indexes for measuring the recent boom-bust cycle,” by Dorsey, R.E., Hu, H., Mayer, W.J., and Wang, H.C., Journal of Housing Economics 19 (2), 75–93.
The FNC National Residential Price Index is a volume-weighted aggregate price index consisting of 100 major metropolitan areas across different regions of the U.S. All FNC Residential Price Indices are constructed to capture unsmoothed home price trends.